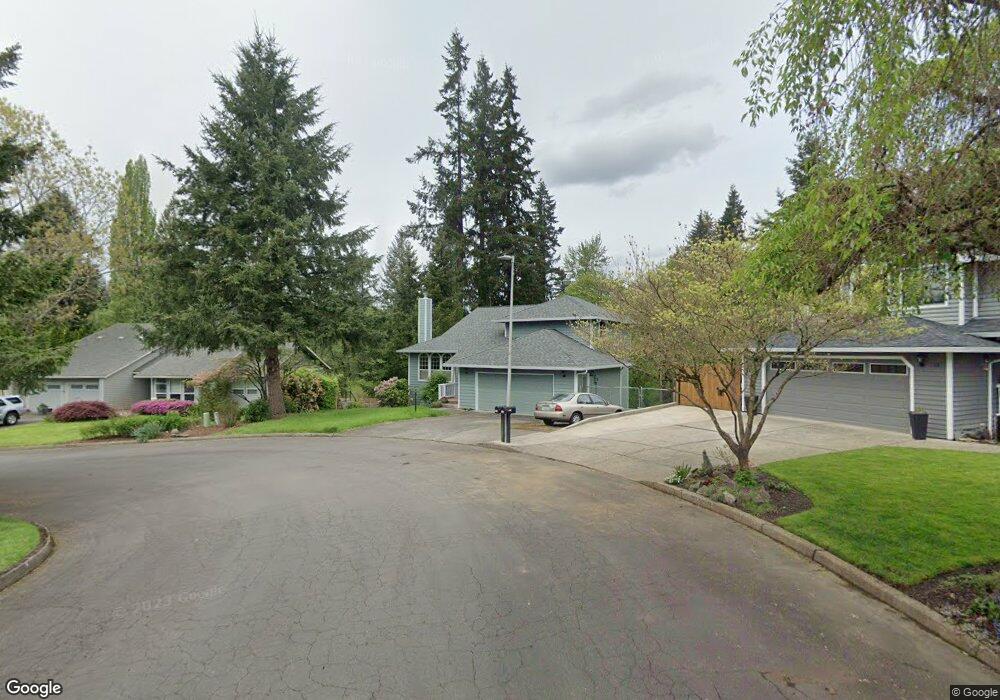
728 NW 104th Loop Vancouver, WA 98685
Estimated Value: $537,665 - $607,000
3
Beds
3
Baths
1,676
Sq Ft
$335/Sq Ft
Est. Value
About This Home
This home is located at 728 NW 104th Loop, Vancouver, WA 98685 and is currently estimated at $560,666, approximately $334 per square foot. 728 NW 104th Loop is a home located in Clark County with nearby schools including Sacajawea Elementary School, Jefferson Middle School, and Columbia River High School.
Ownership History
Date
Name
Owned For
Owner Type
Purchase Details
Closed on
Jul 15, 2014
Sold by
Cartwright Wesley D and Cartwright Meladie M
Bought by
Selzer Noah and Selzer Yuriko
Current Estimated Value
Home Financials for this Owner
Home Financials are based on the most recent Mortgage that was taken out on this home.
Original Mortgage
$133,121
Outstanding Balance
$101,170
Interest Rate
4.1%
Mortgage Type
New Conventional
Estimated Equity
$459,496
Purchase Details
Closed on
Apr 23, 2009
Sold by
Schmidt Kevin and Schmidt Erin
Bought by
Cartwright Wesley Dean and Hancock Meladie M
Home Financials for this Owner
Home Financials are based on the most recent Mortgage that was taken out on this home.
Original Mortgage
$239,580
Interest Rate
5.02%
Mortgage Type
FHA
Purchase Details
Closed on
Apr 26, 2000
Sold by
Pechman Nancy K
Bought by
Schmidt Kevin C and Schmidt Erin E
Home Financials for this Owner
Home Financials are based on the most recent Mortgage that was taken out on this home.
Original Mortgage
$151,905
Interest Rate
8.24%
Create a Home Valuation Report for This Property
The Home Valuation Report is an in-depth analysis detailing your home's value as well as a comparison with similar homes in the area
Home Values in the Area
Average Home Value in this Area
Purchase History
| Date | Buyer | Sale Price | Title Company |
|---|---|---|---|
| Selzer Noah | $41,242 | Chicago Title Insurance | |
| Cartwright Wesley Dean | $244,280 | Stewart Title | |
| Schmidt Kevin C | $159,900 | Charter Title Corporation |
Source: Public Records
Mortgage History
| Date | Status | Borrower | Loan Amount |
|---|---|---|---|
| Open | Selzer Noah | $133,121 | |
| Previous Owner | Cartwright Wesley Dean | $239,580 | |
| Previous Owner | Schmidt Kevin C | $151,905 |
Source: Public Records
Tax History Compared to Growth
Tax History
| Year | Tax Paid | Tax Assessment Tax Assessment Total Assessment is a certain percentage of the fair market value that is determined by local assessors to be the total taxable value of land and additions on the property. | Land | Improvement |
|---|---|---|---|---|
| 2025 | $4,888 | $495,232 | $215,760 | $279,472 |
| 2024 | $4,598 | $462,046 | $215,760 | $246,286 |
| 2023 | $4,323 | $486,331 | $218,080 | $268,251 |
| 2022 | $4,383 | $438,241 | $218,080 | $220,161 |
| 2021 | $4,219 | $396,155 | $183,563 | $212,592 |
| 2020 | $3,801 | $357,761 | $166,354 | $191,407 |
| 2019 | $3,471 | $342,254 | $166,354 | $175,900 |
| 2018 | $3,827 | $324,227 | $0 | $0 |
| 2017 | $3,398 | $298,556 | $0 | $0 |
| 2016 | $3,011 | $275,616 | $0 | $0 |
| 2015 | $2,963 | $227,760 | $0 | $0 |
| 2014 | -- | $216,407 | $0 | $0 |
| 2013 | -- | $202,413 | $0 | $0 |
Source: Public Records
Map
Nearby Homes
- 10601 NW 7th Ave
- 905 NW 105th Cir
- 314 NW 102nd St
- 10214 NW 11th Ave
- 11110 NW 11th Ave
- 11009 NW 11th Place
- 11001 NW 12th Ave
- 1100 NW 111th Cir
- 11302 NW 7th Ave
- 208 NE 106th St
- 102 NW 99th St
- 1607 NW 105th St
- 420 NE 103rd St
- 421 NE 105th St Unit 421
- 806 NW 94th St
- 118 NW 95th Cir
- 415 NW 117th St
- 1705 NW Terrace St
- 11620 NW 2nd Ct
- 11111 NW 19th Ave
- 724 NW 104th Loop
- 802 NW 104th Loop
- 720 NW 104th Loop
- 721 NW 104th Loop
- 810 NW 104th Loop
- 716 NW 104th Loop
- 802 NW 104th St
- 708 NW 104th St
- 10615 NW 11th Ave
- 10615 NW 11th Ave
- 816 NW 104th Loop
- 810 NW 104th St
- 820 NW 104th Loop
- 702 NW 104th St
- 725 NW 104th St
- 715 NW 104th St
- 824 NW 104th Loop
- 907 NW 106th Cir
- 803 NW 104th St
- 707 NW 104th St