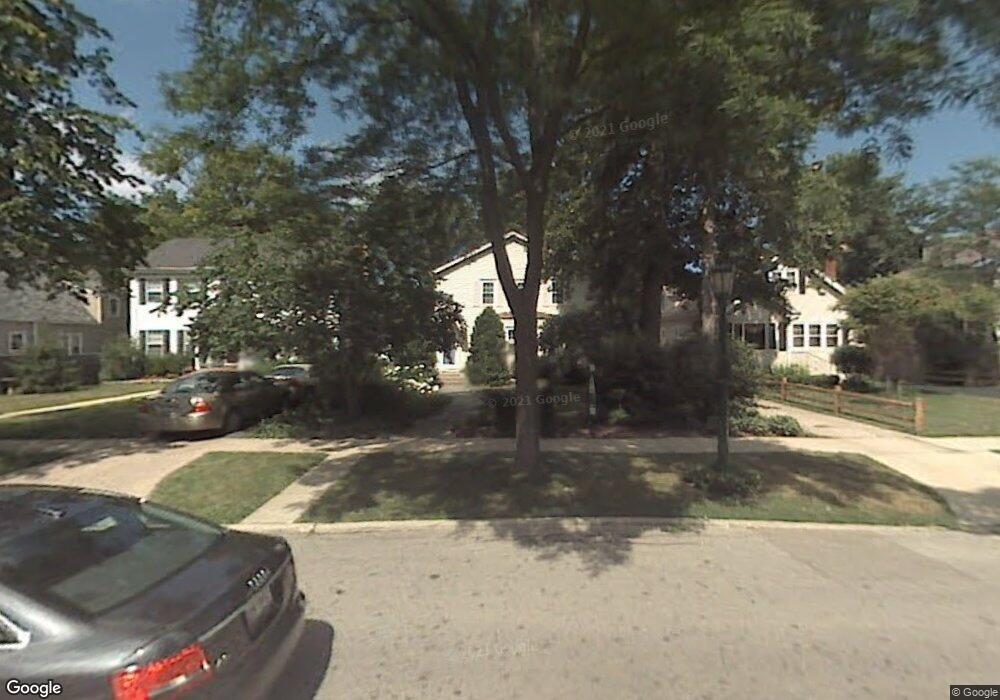
728 Park Ave Wilmette, IL 60091
Estimated Value: $965,000 - $1,233,000
3
Beds
3
Baths
2,058
Sq Ft
$536/Sq Ft
Est. Value
About This Home
This home is located at 728 Park Ave, Wilmette, IL 60091 and is currently estimated at $1,102,559, approximately $535 per square foot. 728 Park Ave is a home located in Cook County with nearby schools including McKenzie Elementary School, Highcrest Middle School, and Wilmette Junior High School.
Ownership History
Date
Name
Owned For
Owner Type
Purchase Details
Closed on
Jul 27, 2009
Sold by
Chouinard Paul L
Bought by
Keenan Kelly and Darnutzer Denton
Current Estimated Value
Home Financials for this Owner
Home Financials are based on the most recent Mortgage that was taken out on this home.
Original Mortgage
$417,000
Outstanding Balance
$274,921
Interest Rate
5.43%
Mortgage Type
Unknown
Estimated Equity
$827,638
Purchase Details
Closed on
Aug 10, 2004
Sold by
Hanson Gregory Alan and Hanson Peggy Rose
Bought by
Chouinard Paul L
Purchase Details
Closed on
Jul 26, 1997
Sold by
Szwaya Robert H and Szwaya Amy B
Bought by
Hanson Gregory Alan and Hanson Peggy Rose
Home Financials for this Owner
Home Financials are based on the most recent Mortgage that was taken out on this home.
Original Mortgage
$160,000
Interest Rate
6.87%
Create a Home Valuation Report for This Property
The Home Valuation Report is an in-depth analysis detailing your home's value as well as a comparison with similar homes in the area
Home Values in the Area
Average Home Value in this Area
Purchase History
| Date | Buyer | Sale Price | Title Company |
|---|---|---|---|
| Keenan Kelly | $590,000 | Pntn | |
| Chouinard Paul L | $635,000 | M G R Title | |
| Hanson Gregory Alan | $410,000 | 1St American Title |
Source: Public Records
Mortgage History
| Date | Status | Borrower | Loan Amount |
|---|---|---|---|
| Open | Keenan Kelly | $417,000 | |
| Previous Owner | Hanson Gregory Alan | $160,000 |
Source: Public Records
Tax History Compared to Growth
Tax History
| Year | Tax Paid | Tax Assessment Tax Assessment Total Assessment is a certain percentage of the fair market value that is determined by local assessors to be the total taxable value of land and additions on the property. | Land | Improvement |
|---|---|---|---|---|
| 2024 | $17,174 | $79,000 | $18,219 | $60,781 |
| 2023 | $16,232 | $79,000 | $18,219 | $60,781 |
| 2022 | $16,232 | $79,000 | $18,219 | $60,781 |
| 2021 | $12,914 | $53,038 | $13,250 | $39,788 |
| 2020 | $14,180 | $58,589 | $13,250 | $45,339 |
| 2019 | $14,075 | $65,131 | $13,250 | $51,881 |
| 2018 | $10,666 | $48,266 | $11,262 | $37,004 |
| 2017 | $10,630 | $49,327 | $11,262 | $38,065 |
| 2016 | $10,762 | $52,010 | $11,262 | $40,748 |
| 2015 | $11,976 | $50,863 | $9,275 | $41,588 |
| 2014 | $12,426 | $50,863 | $9,275 | $41,588 |
| 2013 | $11,867 | $50,863 | $9,275 | $41,588 |
Source: Public Records
Map
Nearby Homes
- 705 Park Ave
- 621 Green Bay Rd
- 724 12th St Unit 105
- 1136 Greenleaf Ave Unit 303
- 410 Prairie Ave
- 705 11th St Unit 307
- 1320 Maple Ave
- 1107 Greenleaf Ave Unit 4G
- 1025 Central Ave
- 1118 Forest Ave
- 1303 Maple Ave
- 1416 Elmwood Ave
- 1617 Forest Ave
- 1606 Forest Ave
- 1249 Maple Ave
- 1531 Wilmette Ave
- 1209 Maple Ave
- 521 10th St
- 1422 Gregory Ave
- 1517 Gregory Ave
- 724 Park Ave
- 732 Park Ave
- 1229 Washington Ave
- 736 Park Ave
- 1225 Washington Ave
- 1225 Washington Ave
- 720 Park Ave
- 1223 Washington Ave
- 712 Park Ave
- 1240 Central Ave
- 1238 Central Ave
- 710 Park Ave
- 800 Park Ave
- 731 Park Ave
- 727 Park Ave
- 723 Park Ave
- 737 Park Ave
- 708 Park Ave
- 1236 Central Ave
- 1228 Washington Ave