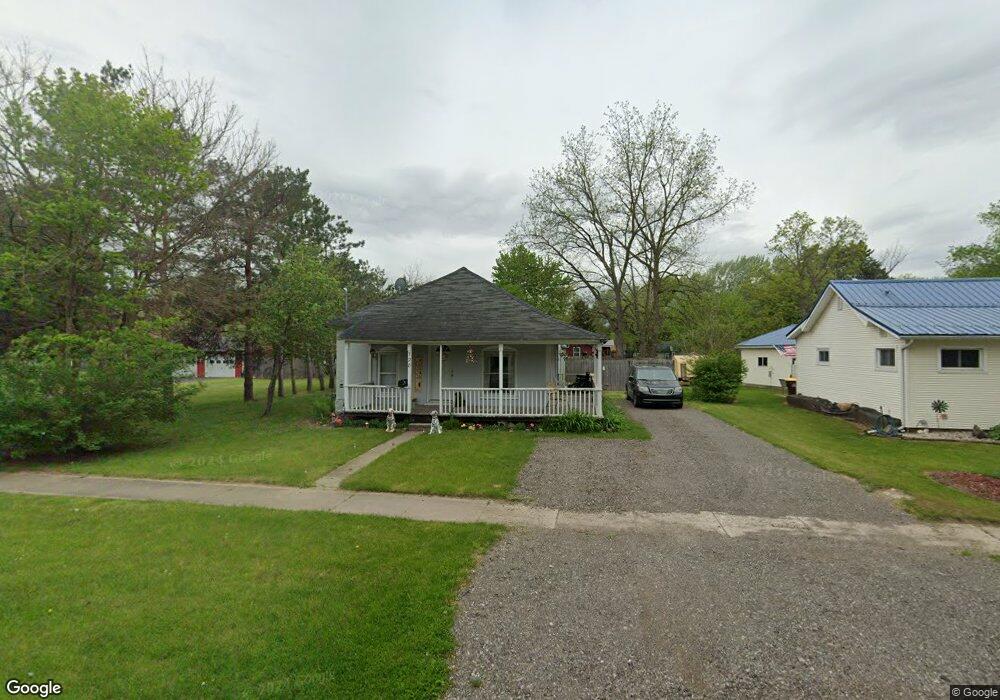
728 S Line St Chesaning, MI 48616
Estimated Value: $121,609 - $143,000
3
Beds
1
Bath
1,184
Sq Ft
$111/Sq Ft
Est. Value
About This Home
This home is located at 728 S Line St, Chesaning, MI 48616 and is currently estimated at $131,402, approximately $110 per square foot. 728 S Line St is a home located in Saginaw County with nearby schools including Big Rock Elementary School, Chesaning Middle School, and Chesaning Union High School.
Ownership History
Date
Name
Owned For
Owner Type
Purchase Details
Closed on
Mar 15, 2020
Sold by
Pumford Alan J and Pumford Sharon M
Bought by
Pumford Properties Llc
Current Estimated Value
Purchase Details
Closed on
Feb 12, 1999
Sold by
Lickman William M
Bought by
Pumford Alan J and Pumford Sharon M
Home Financials for this Owner
Home Financials are based on the most recent Mortgage that was taken out on this home.
Original Mortgage
$32,500
Outstanding Balance
$8,757
Interest Rate
8.62%
Mortgage Type
Purchase Money Mortgage
Estimated Equity
$122,645
Create a Home Valuation Report for This Property
The Home Valuation Report is an in-depth analysis detailing your home's value as well as a comparison with similar homes in the area
Purchase History
| Date | Buyer | Sale Price | Title Company |
|---|---|---|---|
| Pumford Properties Llc | -- | None Available | |
| Pumford Alan J | $26,000 | Title Office | |
| -- | $26,000 | -- |
Source: Public Records
Mortgage History
| Date | Status | Borrower | Loan Amount |
|---|---|---|---|
| Open | -- | $32,500 |
Source: Public Records
Tax History Compared to Growth
Tax History
| Year | Tax Paid | Tax Assessment Tax Assessment Total Assessment is a certain percentage of the fair market value that is determined by local assessors to be the total taxable value of land and additions on the property. | Land | Improvement |
|---|---|---|---|---|
| 2025 | $776 | $55,700 | $0 | $0 |
| 2024 | $758 | $47,300 | $0 | $0 |
| 2023 | $717 | $39,800 | $0 | $0 |
| 2022 | $1,603 | $34,400 | $0 | $0 |
| 2021 | $1,511 | $31,400 | $0 | $0 |
| 2020 | $1,486 | $29,900 | $0 | $0 |
| 2019 | $1,440 | $25,500 | $4,600 | $20,900 |
| 2018 | $665 | $21,700 | $0 | $0 |
| 2017 | $1,346 | $21,500 | $0 | $0 |
| 2016 | $1,334 | $21,100 | $0 | $0 |
| 2014 | -- | $18,700 | $0 | $0 |
| 2013 | -- | $18,700 | $0 | $0 |
Source: Public Records
Map
Nearby Homes