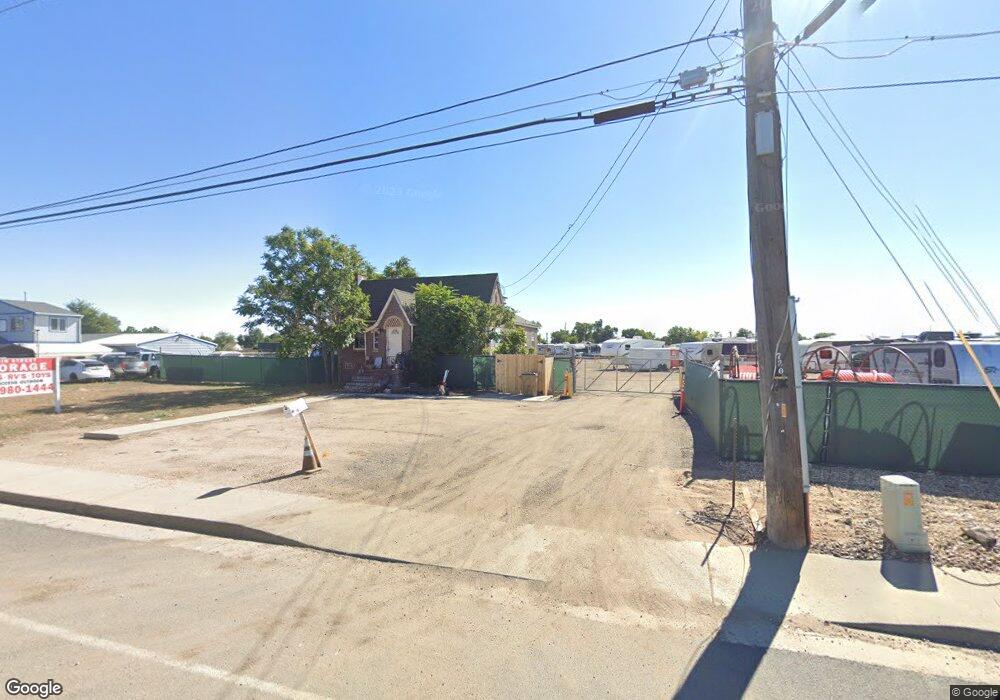
728 S Main St Brighton, CO 80601
Estimated Value: $425,000 - $743,065
3
Beds
1
Bath
1,290
Sq Ft
$428/Sq Ft
Est. Value
About This Home
This home is located at 728 S Main St, Brighton, CO 80601 and is currently estimated at $552,022, approximately $427 per square foot. 728 S Main St is a home located in Adams County with nearby schools including South Elementary School, Vikan Middle School, and Brighton High School.
Ownership History
Date
Name
Owned For
Owner Type
Purchase Details
Closed on
Apr 27, 2000
Sold by
Brighton Grain Co Inc
Bought by
Mihalcin David and Digiorgio Gary
Current Estimated Value
Home Financials for this Owner
Home Financials are based on the most recent Mortgage that was taken out on this home.
Original Mortgage
$222,529
Interest Rate
8.18%
Mortgage Type
Purchase Money Mortgage
Purchase Details
Closed on
May 1, 1995
Sold by
Dreyer Stanley W and Dreyer Sharron S
Bought by
Gunson Mark D and Gunson Judy L
Home Financials for this Owner
Home Financials are based on the most recent Mortgage that was taken out on this home.
Original Mortgage
$49,725
Interest Rate
8.36%
Mortgage Type
Seller Take Back
Create a Home Valuation Report for This Property
The Home Valuation Report is an in-depth analysis detailing your home's value as well as a comparison with similar homes in the area
Home Values in the Area
Average Home Value in this Area
Purchase History
| Date | Buyer | Sale Price | Title Company |
|---|---|---|---|
| Mihalcin David | $295,000 | -- | |
| Gunson Mark D | $58,500 | -- |
Source: Public Records
Mortgage History
| Date | Status | Borrower | Loan Amount |
|---|---|---|---|
| Closed | Mihalcin David | $222,529 | |
| Previous Owner | Gunson Mark D | $49,725 |
Source: Public Records
Tax History Compared to Growth
Tax History
| Year | Tax Paid | Tax Assessment Tax Assessment Total Assessment is a certain percentage of the fair market value that is determined by local assessors to be the total taxable value of land and additions on the property. | Land | Improvement |
|---|---|---|---|---|
| 2024 | $8,773 | $72,980 | $59,780 | $13,200 |
| 2023 | $8,731 | $82,480 | $61,690 | $20,790 |
| 2022 | $7,458 | $67,900 | $63,430 | $4,470 |
| 2021 | $6,823 | $67,900 | $63,430 | $4,470 |
| 2020 | $6,939 | $70,260 | $63,360 | $6,900 |
| 2019 | $6,945 | $70,260 | $63,360 | $6,900 |
| 2018 | $6,942 | $70,200 | $63,250 | $6,950 |
| 2015 | $6,786 | $68,620 | $60,940 | $7,680 |
| 2014 | -- | $68,140 | $60,460 | $7,680 |
Source: Public Records
Map
Nearby Homes