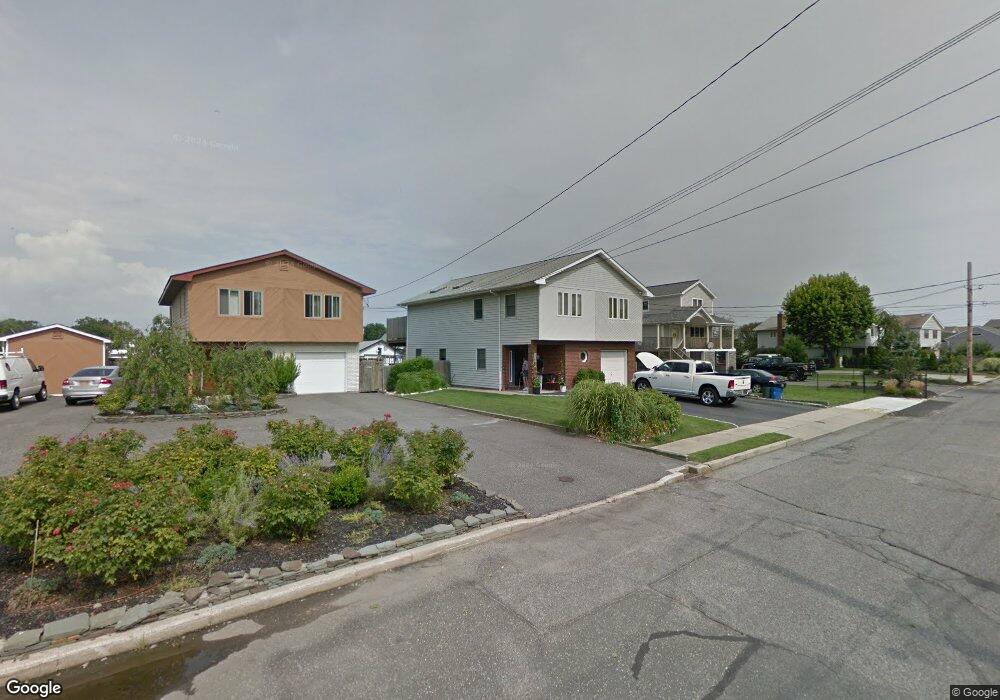
728 Shore Walk Lindenhurst, NY 11757
Estimated Value: $683,785 - $963,000
--
Bed
--
Bath
2,205
Sq Ft
$367/Sq Ft
Est. Value
About This Home
This home is located at 728 Shore Walk, Lindenhurst, NY 11757 and is currently estimated at $809,946, approximately $367 per square foot. 728 Shore Walk is a home located in Suffolk County with nearby schools including Harding Avenue Elementary School, Lindenhurst Middle School, and Lindenhurst Senior High School.
Ownership History
Date
Name
Owned For
Owner Type
Purchase Details
Closed on
Jun 10, 2023
Sold by
Chiang Ming and Wang Wen
Bought by
Chiang Ming and Wang Wen
Current Estimated Value
Purchase Details
Closed on
Feb 23, 2023
Sold by
H J Jr & E C Sampson Irt and Sampson
Bought by
Sampson Family Irt and Sampson
Purchase Details
Closed on
Jun 28, 2018
Sold by
Sampson Harold and Sampson Elaine C
Bought by
Elaine C Sampson Irt and Sampson 3Rd Tr
Purchase Details
Closed on
Oct 2, 2003
Sold by
Sampson Harold
Bought by
Sampson Harold and Sampson Elaine C
Purchase Details
Closed on
Feb 23, 1996
Sold by
Sampson Harold and Sampson Josephine
Bought by
Sampson Harold
Purchase Details
Closed on
Nov 3, 1995
Sold by
Curto Gregory
Bought by
Sampson Harold and Sampson Josephine
Create a Home Valuation Report for This Property
The Home Valuation Report is an in-depth analysis detailing your home's value as well as a comparison with similar homes in the area
Home Values in the Area
Average Home Value in this Area
Purchase History
| Date | Buyer | Sale Price | Title Company |
|---|---|---|---|
| Chiang Ming | $75,000 | None Available | |
| Chiang Ming | $75,000 | None Available | |
| Sampson Family Irt | -- | None Available | |
| Sampson Family Irt | -- | None Available | |
| Elaine C Sampson Irt | -- | -- | |
| Elaine C Sampson Irt | -- | -- | |
| Sampson Harold | -- | -- | |
| Sampson Harold | -- | -- | |
| Sampson Harold | -- | -- | |
| Sampson Harold | -- | -- | |
| Sampson Harold | $235,000 | Chicago Title Insurance Co | |
| Sampson Harold | $235,000 | Chicago Title Insurance Co |
Source: Public Records
Tax History Compared to Growth
Tax History
| Year | Tax Paid | Tax Assessment Tax Assessment Total Assessment is a certain percentage of the fair market value that is determined by local assessors to be the total taxable value of land and additions on the property. | Land | Improvement |
|---|---|---|---|---|
| 2024 | $14,372 | $4,760 | $380 | $4,380 |
| 2023 | $12,550 | $4,760 | $380 | $4,380 |
| 2022 | $12,390 | $4,760 | $380 | $4,380 |
| 2021 | $12,390 | $4,760 | $380 | $4,380 |
| 2020 | $13,197 | $4,930 | $380 | $4,550 |
| 2019 | $14,767 | $0 | $0 | $0 |
| 2018 | $12,312 | $4,930 | $380 | $4,550 |
| 2017 | $12,312 | $4,930 | $380 | $4,550 |
| 2016 | $12,303 | $4,930 | $380 | $4,550 |
| 2015 | -- | $4,930 | $380 | $4,550 |
| 2014 | -- | $4,930 | $380 | $4,550 |
Source: Public Records
Map
Nearby Homes