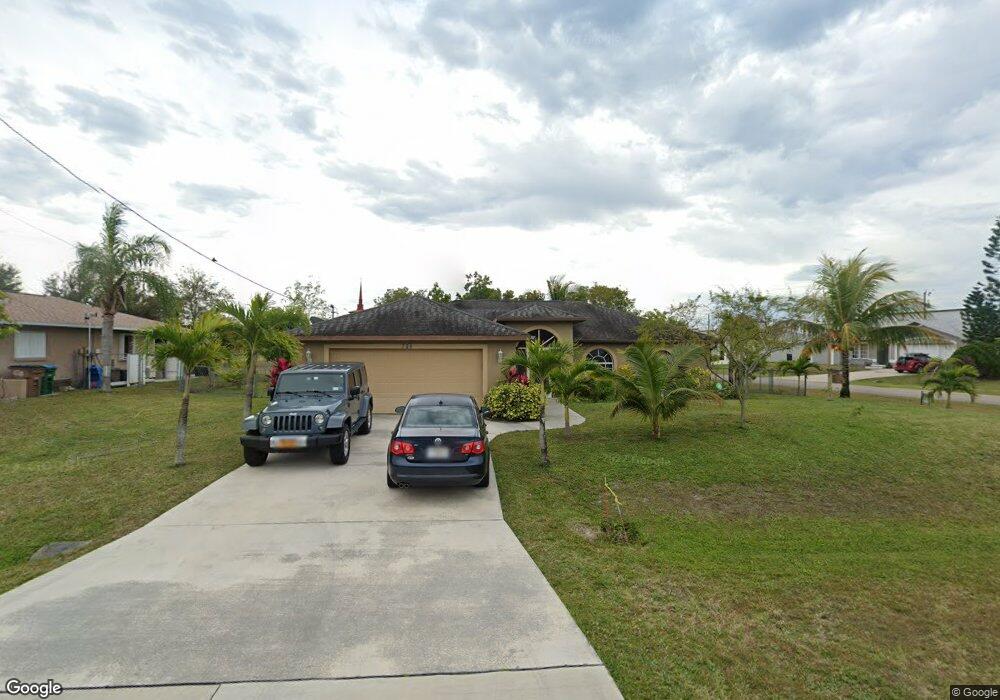
728 SW 9th St Cape Coral, FL 33991
Hancock NeighborhoodEstimated Value: $316,981 - $412,000
3
Beds
2
Baths
1,929
Sq Ft
$187/Sq Ft
Est. Value
About This Home
This home is located at 728 SW 9th St, Cape Coral, FL 33991 and is currently estimated at $360,495, approximately $186 per square foot. 728 SW 9th St is a home located in Lee County with nearby schools including Caloosa Elementary School, Tropic Isles Elementary School, and Hancock Creek Elementary School.
Ownership History
Date
Name
Owned For
Owner Type
Purchase Details
Closed on
Mar 1, 2010
Sold by
Gosselin Michael J and Joslyn Lori A
Bought by
Bracero Abraham and Bracero Isabel
Current Estimated Value
Home Financials for this Owner
Home Financials are based on the most recent Mortgage that was taken out on this home.
Original Mortgage
$71,000
Outstanding Balance
$47,034
Interest Rate
4.97%
Mortgage Type
New Conventional
Estimated Equity
$313,461
Purchase Details
Closed on
Jun 29, 2009
Sold by
First Horizon Home Loans
Bought by
Gosselin Michael J and Gosselin Lori A
Purchase Details
Closed on
Sep 22, 2008
Sold by
Ficili Lynda L and Ficili Lynda
Bought by
First Horizon Home Loans
Purchase Details
Closed on
Oct 28, 2004
Sold by
Osiecki Anthony S and Osiecki Marcella
Bought by
Ficili Lynda L
Home Financials for this Owner
Home Financials are based on the most recent Mortgage that was taken out on this home.
Original Mortgage
$188,500
Interest Rate
5.75%
Mortgage Type
Construction
Create a Home Valuation Report for This Property
The Home Valuation Report is an in-depth analysis detailing your home's value as well as a comparison with similar homes in the area
Home Values in the Area
Average Home Value in this Area
Purchase History
| Date | Buyer | Sale Price | Title Company |
|---|---|---|---|
| Bracero Abraham | $106,000 | Realty Title Solutions Lllp | |
| Gosselin Michael J | $45,000 | Realty Title Solutions Lllp | |
| First Horizon Home Loans | -- | None Available | |
| Ficili Lynda L | $46,000 | -- |
Source: Public Records
Mortgage History
| Date | Status | Borrower | Loan Amount |
|---|---|---|---|
| Open | Bracero Abraham | $71,000 | |
| Previous Owner | Ficili Lynda L | $188,500 |
Source: Public Records
Tax History Compared to Growth
Tax History
| Year | Tax Paid | Tax Assessment Tax Assessment Total Assessment is a certain percentage of the fair market value that is determined by local assessors to be the total taxable value of land and additions on the property. | Land | Improvement |
|---|---|---|---|---|
| 2025 | $4,122 | $271,095 | $76,146 | $192,692 |
| 2024 | $5,177 | $281,730 | $70,802 | $208,328 |
| 2023 | $5,177 | $249,358 | $0 | $0 |
| 2022 | $4,575 | $226,689 | $0 | $0 |
| 2021 | $4,196 | $207,080 | $27,984 | $179,096 |
| 2020 | $3,981 | $187,346 | $24,800 | $162,546 |
| 2019 | $3,782 | $184,110 | $20,000 | $164,110 |
| 2018 | $3,595 | $174,418 | $20,000 | $154,418 |
| 2017 | $3,408 | $163,917 | $12,000 | $151,917 |
| 2016 | $3,149 | $150,166 | $13,830 | $136,336 |
| 2015 | $4,228 | $134,708 | $9,772 | $124,936 |
| 2014 | $3,975 | $118,205 | $8,776 | $109,429 |
| 2013 | -- | $102,503 | $6,828 | $95,675 |
Source: Public Records
Map
Nearby Homes
- 906 SW 7th Ct
- 747 SW 9th St
- 917 SW 8th Place
- 816 Skyline Blvd
- 937 SW 8th Place
- 926 SW 8th Place
- 930 SW 8th Place
- 941 SW 8th Place
- 823 SW 10th St
- 821 SW 8th Ct
- 825 SW 8th Ct
- 817 SW 8th St
- 938 SW 6th Place
- 925 SW 6th Ct Unit 47
- 1005 SW 6th Place
- 909 SW 6th Ct
- 910 SW 9th Ave
- 637 SW 9th Ave
- 805 SW 6th Ct
- 604 SW 8th Place
- 724 SW 9th St
- 922 SW 7th Ct Unit 922
- 922 SW 7th Ct Unit 924
- 922 SW 7th Ct
- 729 SW 9th St
- 725 SW 9th St
- 718 SW 9th St
- 735 SW 9th St
- 721 SW 9th St
- 912 SW 7th Ct
- 914/916 SW 7th Ct
- 717 SW 9th St
- 916 SW 7th Ct
- 732 SW 8th Terrace
- 942 SW 7th Ct
- 712 SW 9th St
- 724 SW 8th Terrace
- 918 SW 7th Ct
- 736 SW 8th Terrace
- 713 SW 9th St