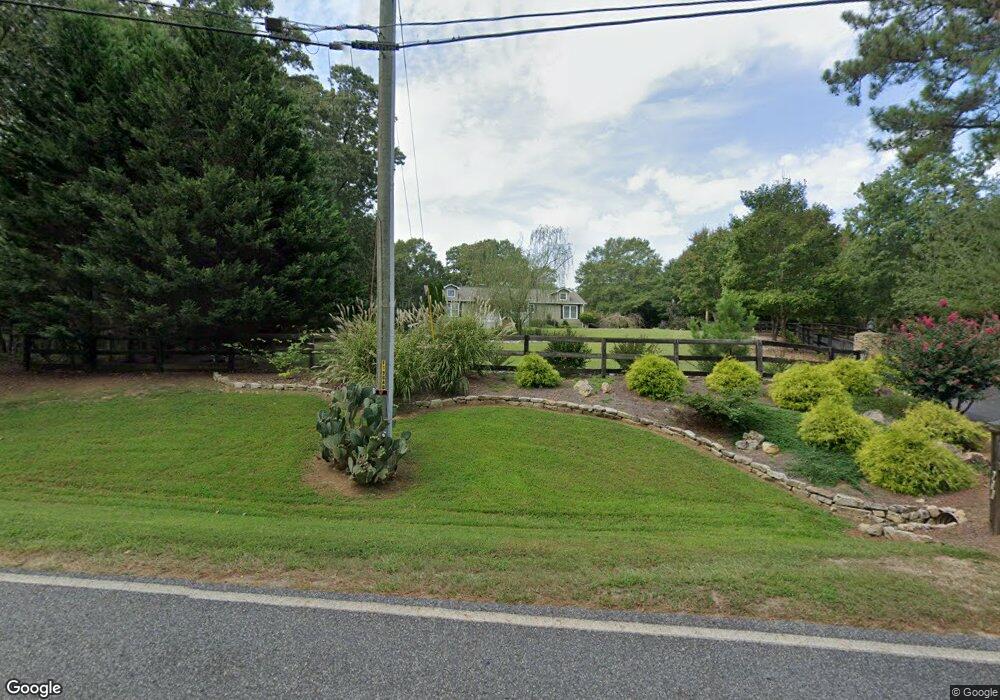
728 Than Skinner Rd Winder, GA 30680
Estimated Value: $426,000 - $669,000
4
Beds
3
Baths
3,040
Sq Ft
$167/Sq Ft
Est. Value
About This Home
This home is located at 728 Than Skinner Rd, Winder, GA 30680 and is currently estimated at $508,284, approximately $167 per square foot. 728 Than Skinner Rd is a home located in Barrow County with nearby schools including Bramlett Elementary School, Russell Middle School, and Winder-Barrow High School.
Ownership History
Date
Name
Owned For
Owner Type
Purchase Details
Closed on
Nov 6, 2017
Sold by
Joseph Tipton
Bought by
Rieger Wencel Thomas and Rieger Diane J
Current Estimated Value
Home Financials for this Owner
Home Financials are based on the most recent Mortgage that was taken out on this home.
Original Mortgage
$327,750
Outstanding Balance
$274,639
Interest Rate
3.85%
Mortgage Type
New Conventional
Estimated Equity
$233,645
Purchase Details
Closed on
Sep 10, 2002
Sold by
Wilson Clara G
Bought by
Tipton Joseph
Home Financials for this Owner
Home Financials are based on the most recent Mortgage that was taken out on this home.
Original Mortgage
$48,000
Interest Rate
6.4%
Mortgage Type
New Conventional
Create a Home Valuation Report for This Property
The Home Valuation Report is an in-depth analysis detailing your home's value as well as a comparison with similar homes in the area
Home Values in the Area
Average Home Value in this Area
Purchase History
| Date | Buyer | Sale Price | Title Company |
|---|---|---|---|
| Rieger Wencel Thomas | $345,000 | -- | |
| Tipton Joseph | $46,500 | -- |
Source: Public Records
Mortgage History
| Date | Status | Borrower | Loan Amount |
|---|---|---|---|
| Open | Rieger Wencel Thomas | $327,750 | |
| Previous Owner | Tipton Joseph | $48,000 |
Source: Public Records
Tax History Compared to Growth
Tax History
| Year | Tax Paid | Tax Assessment Tax Assessment Total Assessment is a certain percentage of the fair market value that is determined by local assessors to be the total taxable value of land and additions on the property. | Land | Improvement |
|---|---|---|---|---|
| 2024 | $3,553 | $147,931 | $27,069 | $120,862 |
| 2023 | $3,123 | $147,931 | $27,069 | $120,862 |
| 2022 | $2,933 | $106,367 | $27,069 | $79,298 |
| 2021 | $2,917 | $100,177 | $21,655 | $78,522 |
| 2020 | $2,613 | $89,823 | $18,000 | $71,823 |
| 2019 | $3,937 | $131,846 | $36,000 | $95,846 |
| 2018 | $3,902 | $131,846 | $36,000 | $95,846 |
| 2017 | $2,225 | $76,430 | $18,000 | $58,430 |
| 2016 | $2,131 | $74,413 | $18,000 | $56,413 |
| 2015 | $2,160 | $75,053 | $18,000 | $57,053 |
| 2014 | $1,939 | $66,539 | $8,820 | $57,719 |
| 2013 | -- | $63,249 | $8,820 | $54,429 |
Source: Public Records
Map
Nearby Homes
- 137 New Cut Rd
- 1931 Windstone Place
- 1686 Shadowstone Ct
- 1929 Windstone Place
- 1557 Shadowstone Cir
- 731 Lincoln Dr
- 2858 Shadowstone Way
- 99 Mcmillian Ct
- 2839 Shadowstone Way
- 1303 Windstone Ct
- 809 Custom Ln
- The Paisley Plan at Rockwell Farms
- The Rockwell Plan at Rockwell Farms
- The Barnes Plan at Rockwell Farms
- The Reynolds Plan at Rockwell Farms
- The Austin Plan at Rockwell Farms
- The Logan Plan at Rockwell Farms
- The Rose II Plan at Rockwell Farms
- 72 Mcmillian Ct
- 1202 Treemont Trace
- 740 Than Skinner Rd
- 707 Will Maynard Rd
- 717 Will Maynard Rd
- 739 Will Maynard Rd
- 714 Will Maynard Rd
- 766 Than Skinner Rd
- 739 Than Skinner Rd Unit 10
- 739 Than Skinner Rd
- 718 Will Maynard Rd
- 746 Will Maynard Rd
- 759 Will Maynard Rd
- 759 Maynard Rd
- 779 Than Skinner Rd
- 707 Than Skinner Rd
- 701 Than Skinner Rd
- 689 Than Skinner Rd
- 792 Than Skinner Rd
- 686 Than Skinner Rd
- 793 Than Skinner Rd
- 747 Than Skinner Rd