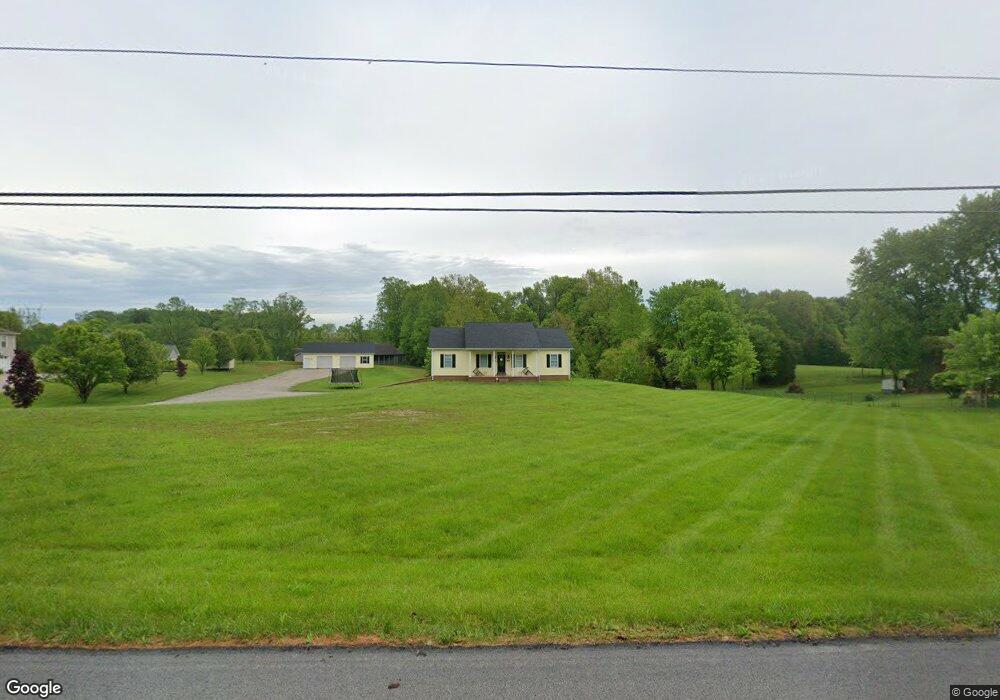
7284 Corydon Junction Rd NE New Salisbury, IN 47161
Estimated Value: $265,000 - $393,704
4
Beds
2
Baths
3,000
Sq Ft
$109/Sq Ft
Est. Value
About This Home
This home is located at 7284 Corydon Junction Rd NE, New Salisbury, IN 47161 and is currently estimated at $327,676, approximately $109 per square foot. 7284 Corydon Junction Rd NE is a home located in Harrison County with nearby schools including North Harrison High School.
Ownership History
Date
Name
Owned For
Owner Type
Purchase Details
Closed on
Apr 23, 2021
Sold by
Julie Withers
Bought by
Waynescott Carla A
Current Estimated Value
Home Financials for this Owner
Home Financials are based on the most recent Mortgage that was taken out on this home.
Original Mortgage
$296,092
Outstanding Balance
$267,335
Interest Rate
3%
Mortgage Type
Construction
Estimated Equity
$60,341
Purchase Details
Closed on
Aug 14, 2020
Sold by
Estate Willoughby
Bought by
Witthers Julie A
Home Financials for this Owner
Home Financials are based on the most recent Mortgage that was taken out on this home.
Interest Rate
2.96%
Purchase Details
Closed on
Jul 25, 2017
Sold by
Norbett
Bought by
Willoughby Harry
Purchase Details
Closed on
Jul 9, 2012
Sold by
Tony Willoughby
Bought by
Cynthia Norbett and Cynthia Lynn Pike
Create a Home Valuation Report for This Property
The Home Valuation Report is an in-depth analysis detailing your home's value as well as a comparison with similar homes in the area
Home Values in the Area
Average Home Value in this Area
Purchase History
| Date | Buyer | Sale Price | Title Company |
|---|---|---|---|
| Waynescott Carla A | $310,000 | Mattingly Ford Title Svcs Llc | |
| Witthers Julie A | $173,800 | -- | |
| Witthers Julie A | $173,800 | -- | |
| Willoughby Harry | -- | -- | |
| Cynthia Norbett | $182,000 | Davis, Davis & Layson |
Source: Public Records
Mortgage History
| Date | Status | Borrower | Loan Amount |
|---|---|---|---|
| Open | Waynescott Carla A | $296,092 | |
| Previous Owner | Witthers Julie A | -- |
Source: Public Records
Tax History Compared to Growth
Tax History
| Year | Tax Paid | Tax Assessment Tax Assessment Total Assessment is a certain percentage of the fair market value that is determined by local assessors to be the total taxable value of land and additions on the property. | Land | Improvement |
|---|---|---|---|---|
| 2024 | $2,293 | $350,200 | $45,300 | $304,900 |
| 2023 | $2,260 | $336,400 | $43,300 | $293,100 |
| 2022 | $1,974 | $280,600 | $38,300 | $242,300 |
| 2021 | $1,739 | $245,600 | $30,800 | $214,800 |
| 2020 | $3,191 | $227,000 | $21,200 | $205,800 |
| 2019 | $3,111 | $221,100 | $19,900 | $201,200 |
| 2018 | $2,884 | $205,900 | $19,900 | $186,000 |
| 2017 | $1,387 | $207,500 | $19,900 | $187,600 |
| 2016 | $1,248 | $207,500 | $19,900 | $187,600 |
| 2014 | $966 | $180,200 | $17,200 | $163,000 |
| 2013 | $966 | $176,500 | $17,200 | $159,300 |
Source: Public Records
Map
Nearby Homes
- 1414 Deer Ridge Way NE
- 7045 Corydon Junction Rd NE
- 0 Hwy 135 Unit Tract 3 2025011288
- 0 Hwy 135 Unit Tract 2 2025011289
- 8136 Wagner Ave NE
- 8186 Timber Ln NE Unit 401
- 8162 Timber Ln NE Unit 403
- 8171 Wagner Ave NE Unit 55
- 8160 Schmidt Ln NE Unit 404
- 8158 Wagner Ave NE
- The Savannah Plan at Kepley Fields
- The Samantha Plan at Kepley Fields - Kepley Meadows
- The Savannah Plan at Kepley Fields - Kepley Meadows
- The Addy Rae Plan at Kepley Fields
- The Tristin Plan at Kepley Fields
- The Emmett Plan at Kepley Fields
- The Calloway Plan at Kepley Fields
- The Whitney Plan at Kepley Fields
- The Riley Plan at Kepley Fields - Kepley Meadows
- The Emmett Plan at Kepley Fields - Kepley Meadows
- 7292 Corydon Junction Rd NE
- 7250 Corydon Junction Rd NE
- 7233 Highway 135 NE
- 7237 Highway 135 NE
- 7324 Corydon Junction Rd NE
- 7230 Corydon Junction Rd NE
- 1498 Deer Ridge Way NE
- 1437 Deer Ridge Way NE
- 7235 Corydon Junction Rd NE
- 7180 Corydon Junction Rd NE
- 7215 Corydon Junction Rd NE
- 1440 Deer Ridge Way NE
- 7328 Corydon Junction Rd NE
- 1435 Deer Ridge Way NE
- 7160 Corydon Junction Rd NE
- 7170 Highway 135 NE
- 7170 Highway 135 NE
- 7170 Indiana 135
- 7365 Corydon Junction Rd NE
- 1436 Deer Ridge Way NE