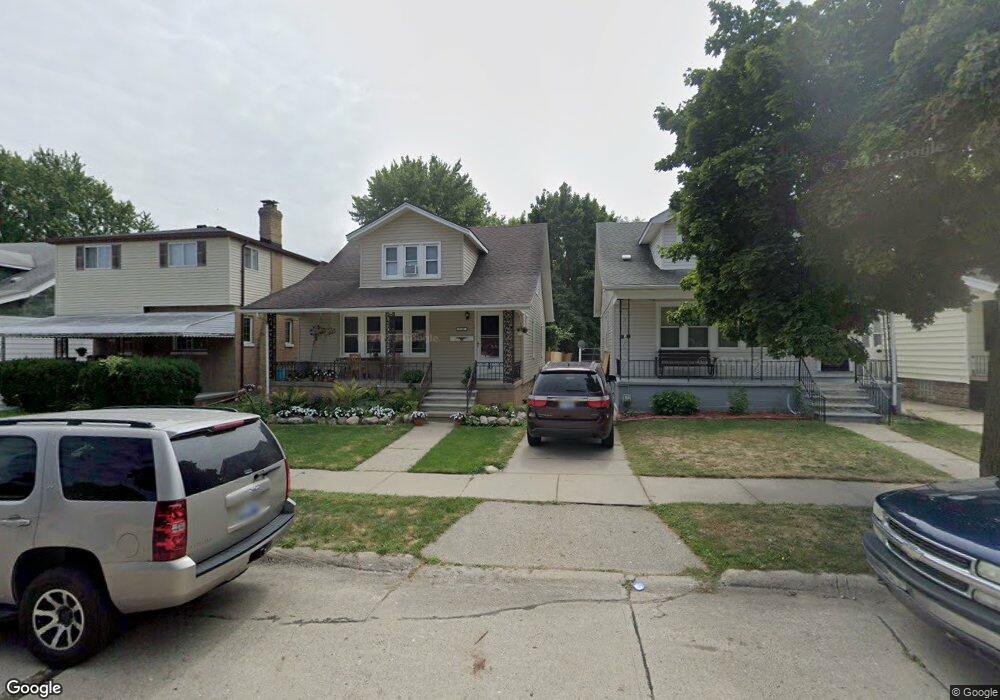
7284 Engleman Center Line, MI 48015
Estimated Value: $162,996 - $215,000
4
Beds
2
Baths
1,554
Sq Ft
$118/Sq Ft
Est. Value
About This Home
This home is located at 7284 Engleman, Center Line, MI 48015 and is currently estimated at $182,749, approximately $117 per square foot. 7284 Engleman is a home located in Macomb County with nearby schools including Crothers Elementary School, Center Line High School, and Wolfe Middle School.
Ownership History
Date
Name
Owned For
Owner Type
Purchase Details
Closed on
Dec 10, 2021
Sold by
Ahmed Mohammed S and Ahmed Sabiah
Bought by
Johnson Rachel
Current Estimated Value
Purchase Details
Closed on
Sep 30, 2020
Sold by
Ahmed Mohammed
Bought by
Sbaf Holdings Llc
Purchase Details
Closed on
Jun 1, 2012
Sold by
Carl J Smith & Joan C Smith Trust
Bought by
Ahmed Mohammed S and Begum Sabiah
Purchase Details
Closed on
Oct 30, 1999
Sold by
Smith Carl J and Smith Joan C
Bought by
Smith Carl J and Smith Joan C
Create a Home Valuation Report for This Property
The Home Valuation Report is an in-depth analysis detailing your home's value as well as a comparison with similar homes in the area
Home Values in the Area
Average Home Value in this Area
Purchase History
| Date | Buyer | Sale Price | Title Company |
|---|---|---|---|
| Johnson Rachel | $140,000 | None Listed On Document | |
| Sbaf Holdings Llc | -- | None Available | |
| Ahmed Mohammed S | $40,000 | Capital Title Ins Agency | |
| Smith Carl J | -- | Capital Title Ins Agency |
Source: Public Records
Tax History Compared to Growth
Tax History
| Year | Tax Paid | Tax Assessment Tax Assessment Total Assessment is a certain percentage of the fair market value that is determined by local assessors to be the total taxable value of land and additions on the property. | Land | Improvement |
|---|---|---|---|---|
| 2025 | $3,548 | $67,700 | $0 | $0 |
| 2024 | $2,802 | $62,200 | $0 | $0 |
| 2023 | $2,703 | $55,200 | $0 | $0 |
| 2022 | $3,349 | $49,800 | $0 | $0 |
| 2021 | $1,785 | $45,800 | $0 | $0 |
| 2020 | $1,456 | $42,800 | $0 | $0 |
| 2019 | $1,861 | $35,300 | $0 | $0 |
| 2018 | $1,856 | $29,680 | $0 | $0 |
| 2017 | $1,707 | $27,210 | $3,450 | $23,760 |
| 2016 | $1,704 | $27,210 | $0 | $0 |
| 2015 | -- | $25,100 | $0 | $0 |
| 2011 | -- | $26,990 | $3,350 | $23,640 |
Source: Public Records
Map
Nearby Homes