7288 Meadow St Unit 9E Anchorage, AK 99507
Abbott Loop NeighborhoodAbout This Home
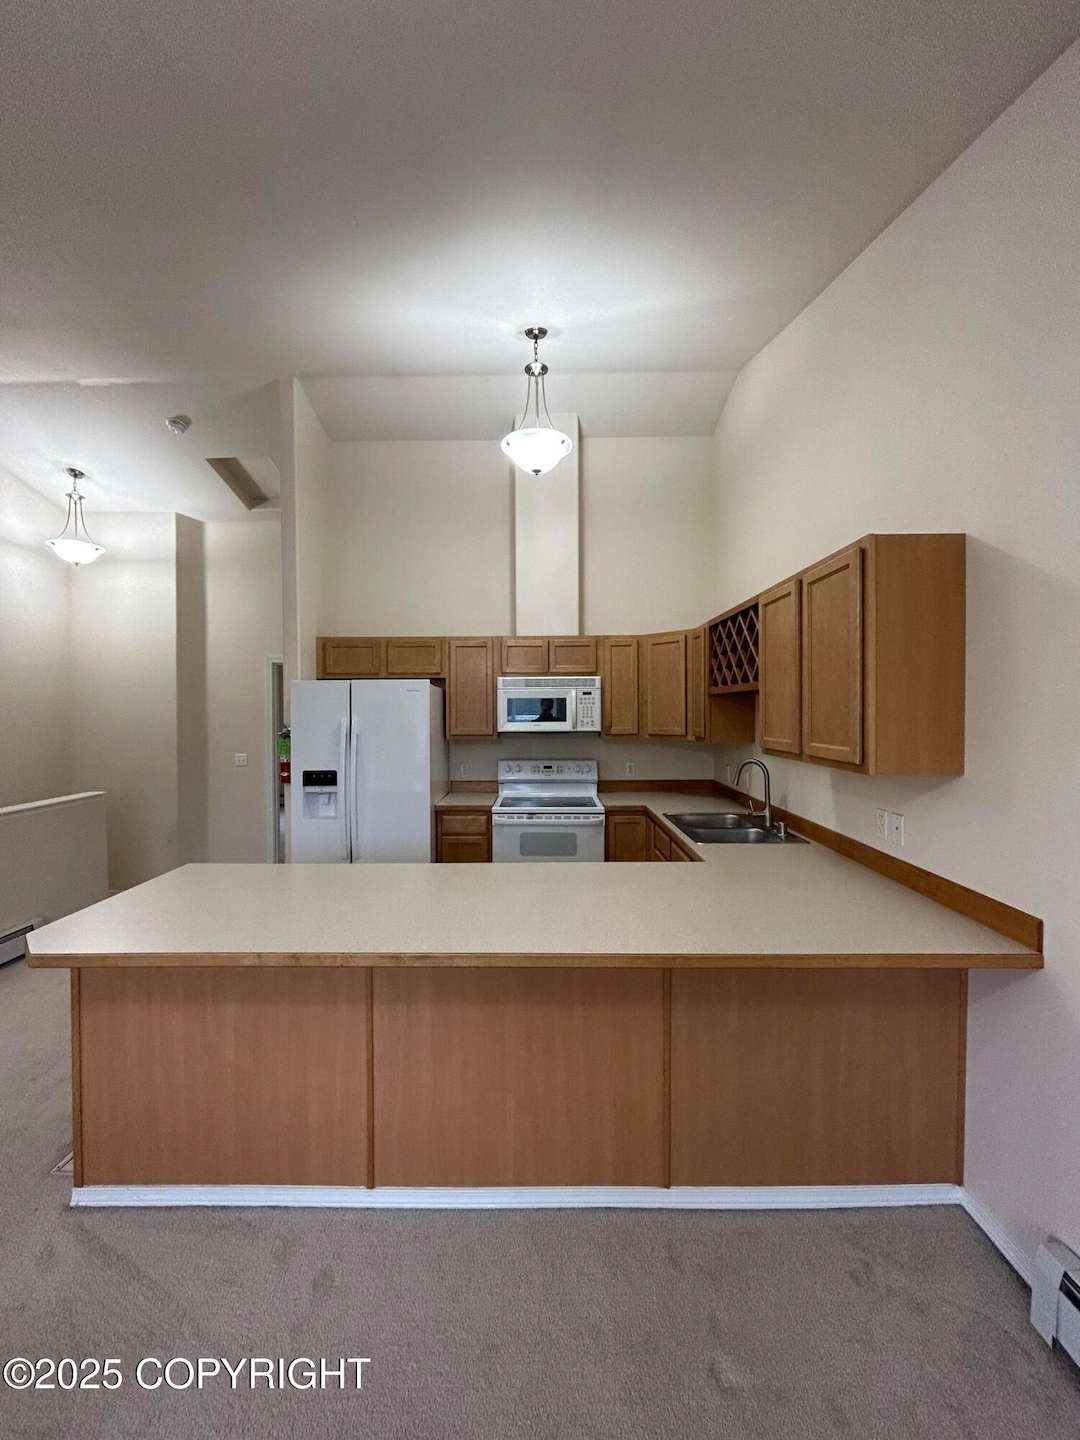
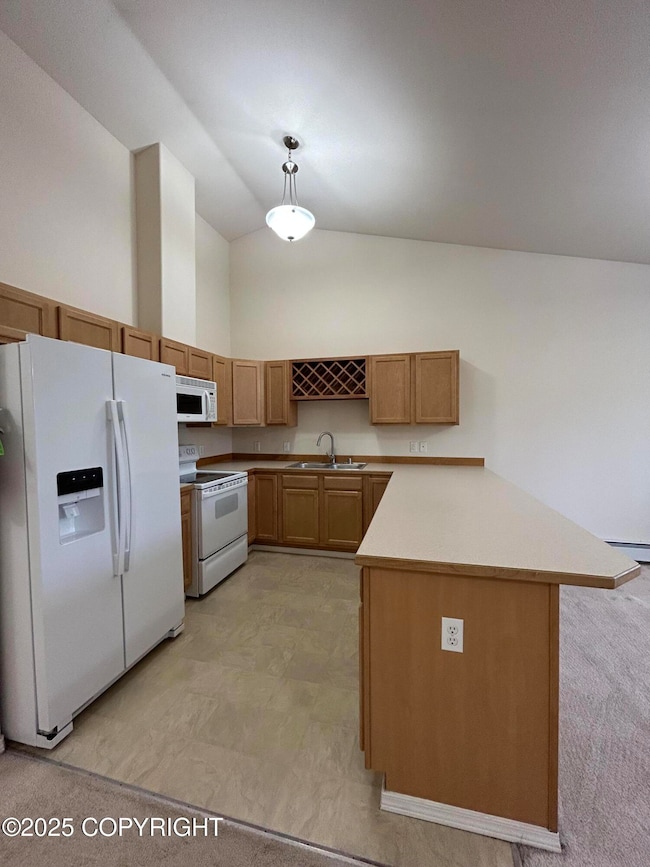
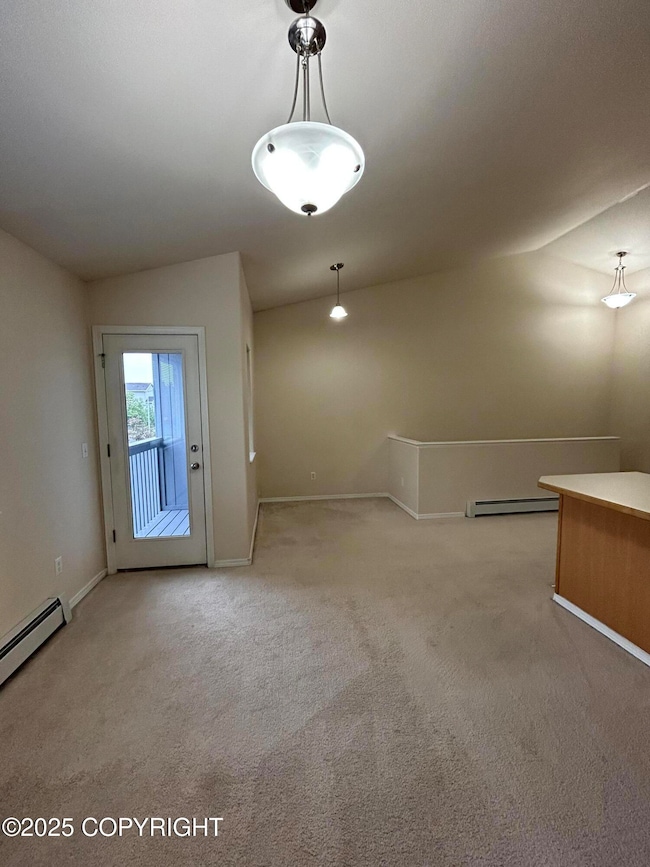
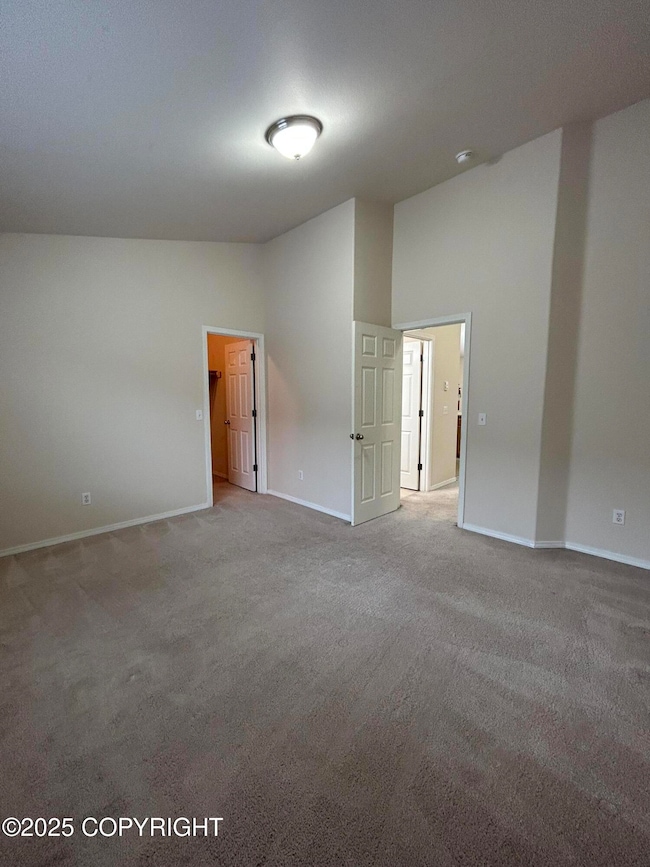
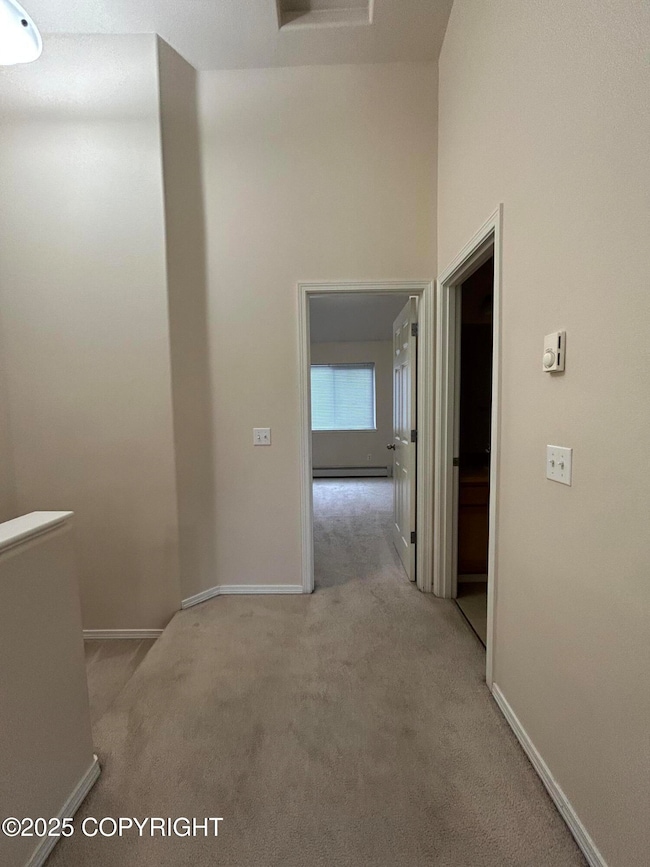
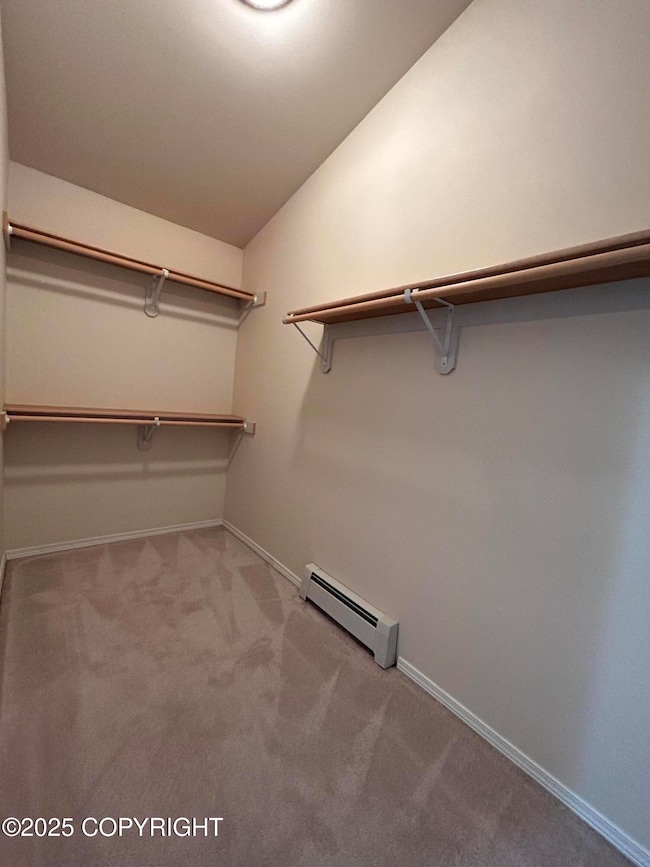
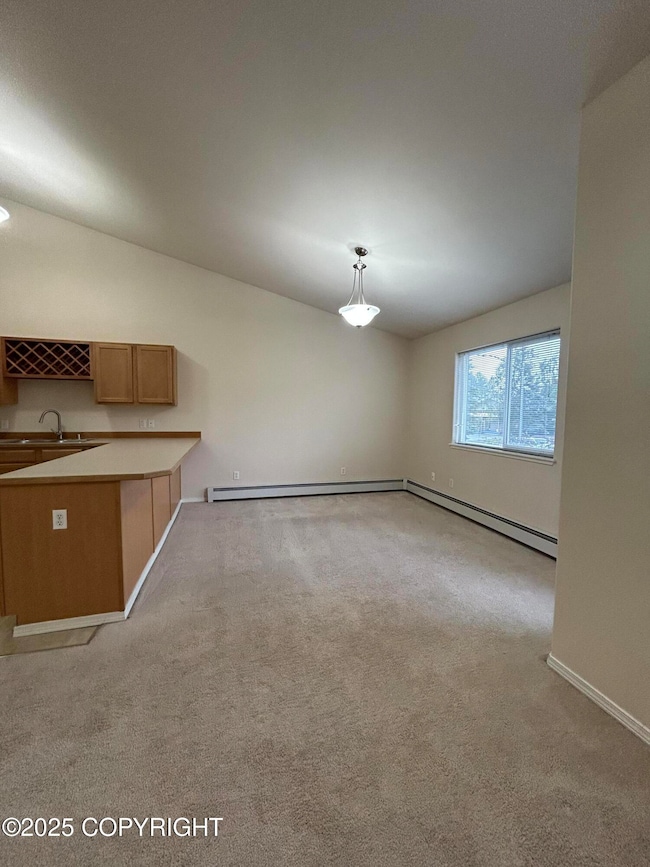
**Thanksgiving Special: $50.00 Fred Meyers Gift Card with Signed Lease and Move-In Completed by Thanksgiving!!**Discover the epitome of townhouse living in South Anchorage, where this exceptional unit awaits. Boasting over 1,000 square feet of fantastic living space, this residence promises both comfort and convenience in a coveted location.With one bedroom and one bathroom on each floor, this home offers optimal privacy and flexibility. The added advantage of a two-car garage ensures effortless parking and storage. Inside, bask in the elegance of vaulted ceilings, the convenience of a washer/dryer, and the modern touch of a built-in microwave. Embrace the outdoors from your private deck and revel in the luxury of walk-in closets. Ideally situated, this property is centrally located, mere moments away from downtown Anchorage and JBER (Joint Base Elmendorf-Richardson). Experience the perfect blend of urban accessibility and serene living in this remarkable townhouse-style unit.

Home Details
Home Type
- Single Family
Est. Annual Taxes
- $3,445
Year Built
- 2007
Interior Spaces
- 1,028 Sq Ft Home
- Vaulted Ceiling
Bedrooms and Bathrooms
- 2 Bedrooms
- 2 Full Bathrooms
Schools
- Abbott Loop Elementary School
- Hanshew Middle School
- Service High School
Map
Source: Alaska Multiple Listing Service
MLS Number: 25-13222
APN: 01412369005
Disclaimer: Certain information contained herein is derived from information provided by parties other than Homes.com. All information provided is deemed reliable, but is not guaranteed to be accurate and should be independently verified.
![]() The listing content relating to real estate for sale on this web site comes in part from the IDX Program of Alaska Multiple Listing Service, Inc. (AK MLS). Real estate listings held by brokerage firms other than Ten-X are marked with either the listing brokerage’s logo or the AK MLS logo and information about them includes the name of the listing brokerage. All information is deemed reliable but is not guaranteed and should be independently verified for accuracy. Copyright 2025 Alaska Multiple Listing Service, Inc. All rights reserved.
The listing content relating to real estate for sale on this web site comes in part from the IDX Program of Alaska Multiple Listing Service, Inc. (AK MLS). Real estate listings held by brokerage firms other than Ten-X are marked with either the listing brokerage’s logo or the AK MLS logo and information about them includes the name of the listing brokerage. All information is deemed reliable but is not guaranteed and should be independently verified for accuracy. Copyright 2025 Alaska Multiple Listing Service, Inc. All rights reserved.
- L19 B2 Chugach Meadows Loop
- L18 B2 Chugach Meadows Loop
- 20 Blk 2 Lt 20 E 73rd Ave
- 7010 Burlwood Dr
- 2022 E 73rd Ave Unit 2
- L25 B2 E 73rd Ave
- 7200 Meadow St
- 7220 Meadow St
- 7210 Meadow St
- 7230 Meadow St
- 1250 E 70th Ave
- 000 E 74th Ave
- 2033 Applewood Cir
- 7230 Basel St
- 6810 Burlwood Dr
- 7725 Cherrywood Cir
- 7730 Little Bend Cir
- 7410 Bern St
- 7827 Old Seward Hwy
- 7441 Glade Place
- 7211 Meadow St
- 7230 Basel St Unit 2
- 6960 Briar Loop Unit 28
- 507 Copperbush Ct Unit 507
- 6641 Hampstead Dr
- 8150 Clear Haven Cir
- 3030 Lore Rd Unit 3030 Lore Road B2
- 1497 N Heather Meadows Loop
- 2134 E 56th Ave
- 2913 Red Currant Cir
- 7401 Foxridge Way
- 7270 Huntsmen Cir Unit C
- 7545 Foxridge Way
- 5640 Lake Otis Pkwy
- 579 E Dowling Rd
- 5510 Trena St
- 7570 Foxridge Way Unit B
- 310 W 76th Ave
- 5215 Mockingbird Dr
- 5360 Lake Otis Pkwy Unit 4