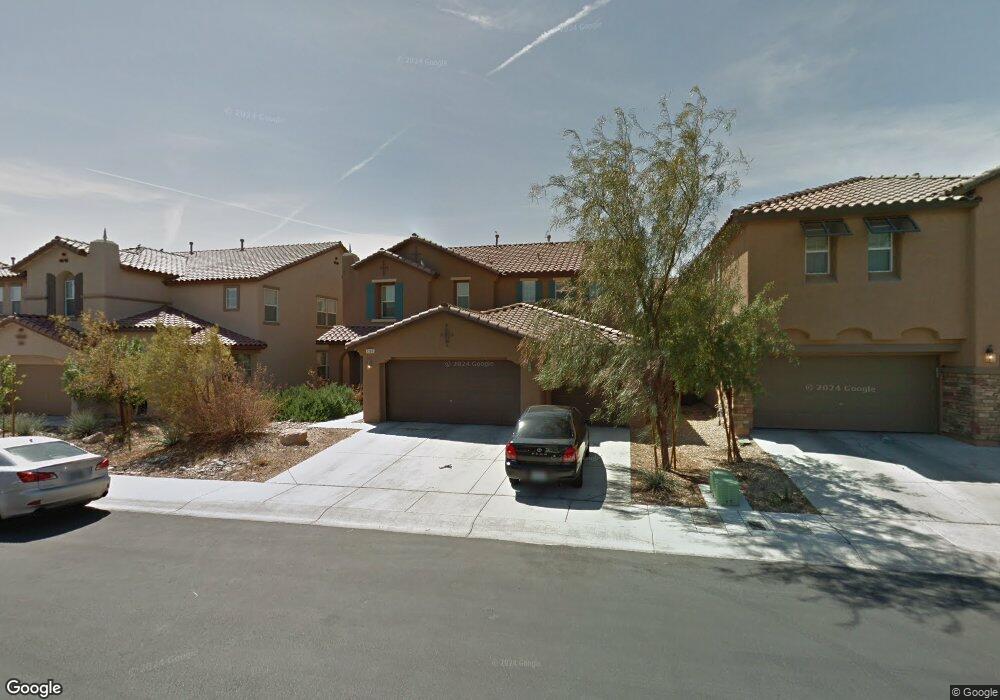
7289 Crow Canyon Ave Unit 3A Las Vegas, NV 89179
Mountains Edge NeighborhoodEstimated Value: $665,000 - $756,000
5
Beds
4
Baths
3,081
Sq Ft
$228/Sq Ft
Est. Value
About This Home
This home is located at 7289 Crow Canyon Ave Unit 3A, Las Vegas, NV 89179 and is currently estimated at $702,820, approximately $228 per square foot. 7289 Crow Canyon Ave Unit 3A is a home located in Clark County with nearby schools including Jones Blackhurst Elementary School, Desert Oasis High School, and Doral Academy West Pebble.
Ownership History
Date
Name
Owned For
Owner Type
Purchase Details
Closed on
Sep 2, 2021
Sold by
Haiek Josephine A
Bought by
Haiek Josephine A and Haiek Raquel E
Current Estimated Value
Purchase Details
Closed on
Nov 16, 2011
Sold by
Federal Home Loan Mortgage Corporation
Bought by
Hajek Josephine
Home Financials for this Owner
Home Financials are based on the most recent Mortgage that was taken out on this home.
Original Mortgage
$189,000
Interest Rate
3.93%
Mortgage Type
New Conventional
Purchase Details
Closed on
Jun 24, 2011
Sold by
Gunn Paul
Bought by
Federal Home Loan Mortgage Corporation
Purchase Details
Closed on
Jun 11, 2007
Sold by
Kb Home Nevada Inc
Bought by
Gunn Paul
Home Financials for this Owner
Home Financials are based on the most recent Mortgage that was taken out on this home.
Original Mortgage
$369,233
Interest Rate
5.62%
Mortgage Type
Unknown
Create a Home Valuation Report for This Property
The Home Valuation Report is an in-depth analysis detailing your home's value as well as a comparison with similar homes in the area
Home Values in the Area
Average Home Value in this Area
Purchase History
| Date | Buyer | Sale Price | Title Company |
|---|---|---|---|
| Haiek Josephine A | -- | None Listed On Document | |
| Hajek Josephine | $210,000 | Nevada Title Las Vegas | |
| Federal Home Loan Mortgage Corporation | $216,000 | Pasion Title Services | |
| Gunn Paul | $418,023 | First Amer Title Co Of Nv |
Source: Public Records
Mortgage History
| Date | Status | Borrower | Loan Amount |
|---|---|---|---|
| Previous Owner | Hajek Josephine | $189,000 | |
| Previous Owner | Gunn Paul | $369,233 |
Source: Public Records
Tax History Compared to Growth
Tax History
| Year | Tax Paid | Tax Assessment Tax Assessment Total Assessment is a certain percentage of the fair market value that is determined by local assessors to be the total taxable value of land and additions on the property. | Land | Improvement |
|---|---|---|---|---|
| 2025 | $2,899 | $204,572 | $45,500 | $159,072 |
| 2024 | $4,739 | $204,572 | $45,500 | $159,072 |
| 2023 | $2,297 | $198,381 | $49,000 | $149,381 |
| 2022 | $2,866 | $170,875 | $35,000 | $135,875 |
| 2021 | $2,775 | $147,435 | $35,000 | $112,435 |
| 2020 | $2,573 | $140,733 | $33,250 | $107,483 |
| 2019 | $2,542 | $135,389 | $29,750 | $105,639 |
| 2018 | $2,426 | $118,535 | $25,900 | $92,635 |
| 2017 | $3,352 | $114,297 | $25,550 | $88,747 |
| 2016 | $2,297 | $102,658 | $17,500 | $85,158 |
| 2015 | $2,297 | $93,662 | $15,750 | $77,912 |
| 2014 | $2,226 | $73,622 | $9,450 | $64,172 |
Source: Public Records
Map
Nearby Homes
- 7286 Caballo Range Ave
- 7182 Hood River Ave
- 7397 Cobbhan Dr
- 7428 Alamo Ranch Ave
- 7115 Hickory Post Ave
- 7125 Mountain Den Ave
- 7063 Bering Strait Ave
- 7057 Fort Union Ct
- 7125 Neches Ave
- 7357 Palo Real Ct
- 7012 Grand Junction Ave
- 6994 Geronimo Springs Ave
- 7160 Mineral Park Ave
- 0 W Erie Ave
- 10917 Prudhoe Bay St
- 7612 Kit Carson Ave
- 11068 Hunting Hawk Rd
- 7440 Earnshaw Ave
- 7622 Kit Carson Ave
- 7104 Flathead River Ave
- 7279 Crow Canyon Ave
- 7299 Crow Canyon Ave
- 7292 Commanche Agate Ct
- 7309 Crow Canyon Ave
- 7269 Crow Canyon Ave
- 7269 Crow Canyon Ave Unit n/a
- 7282 Commanche Agate Ct
- 7302 Commanche Agate Ct
- 7288 Crow Canyon Ave
- 7312 Commanche Agate Ct
- 7272 Commanche Agate Ct
- 7298 Crow Canyon Ave
- 7278 Crow Canyon Ave
- 7319 Crow Canyon Ave
- 7308 Crow Canyon Ave
- 7268 Crow Canyon Ave
- 7322 Commanche Agate Ct
- 7329 Crow Canyon Ave Unit 3A
- 7318 Crow Canyon Ave
- 7258 Crow Canyon Ave