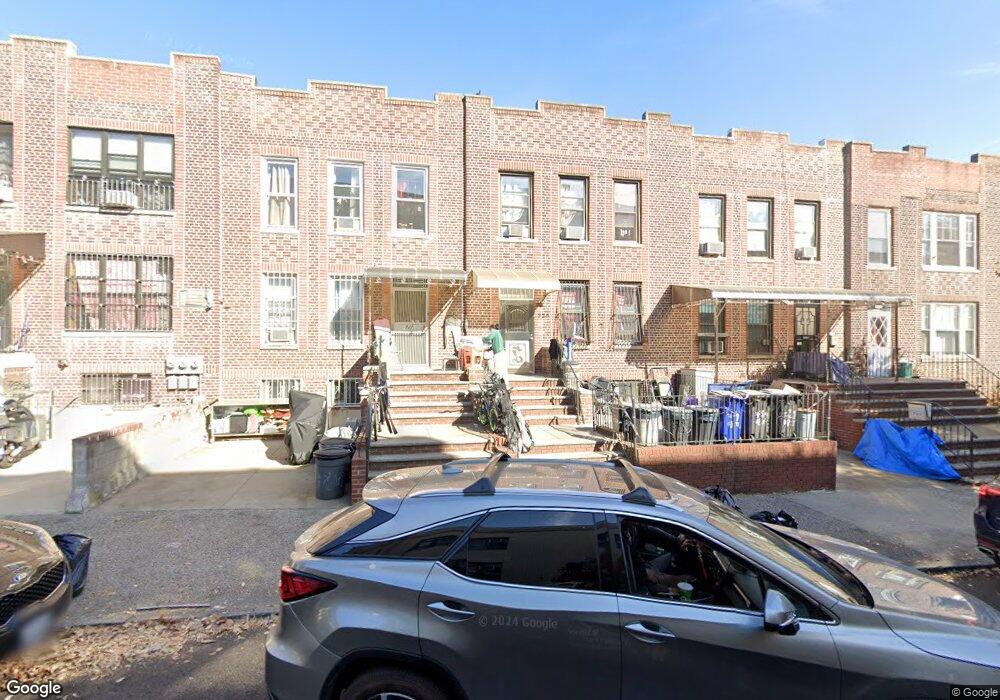
729 48th St Brooklyn, NY 11220
Sunset Park NeighborhoodEstimated Value: $1,335,062 - $1,806,000
--
Bed
--
Bath
2,272
Sq Ft
$699/Sq Ft
Est. Value
About This Home
This home is located at 729 48th St, Brooklyn, NY 11220 and is currently estimated at $1,588,016, approximately $698 per square foot. 729 48th St is a home located in Kings County with nearby schools including P.S. 169 Sunset Park, IS 220 John J. Pershing, and Kehilath Yakov Pupa.
Ownership History
Date
Name
Owned For
Owner Type
Purchase Details
Closed on
Jun 10, 2015
Sold by
Staiano Louis T
Bought by
Chen Li Yi and Xiao Wen
Current Estimated Value
Home Financials for this Owner
Home Financials are based on the most recent Mortgage that was taken out on this home.
Original Mortgage
$480,000
Outstanding Balance
$372,963
Interest Rate
3.84%
Mortgage Type
New Conventional
Estimated Equity
$1,215,053
Purchase Details
Closed on
Feb 19, 2014
Sold by
Staiano Deceased Ruth
Bought by
Henry Vincent E
Create a Home Valuation Report for This Property
The Home Valuation Report is an in-depth analysis detailing your home's value as well as a comparison with similar homes in the area
Home Values in the Area
Average Home Value in this Area
Purchase History
| Date | Buyer | Sale Price | Title Company |
|---|---|---|---|
| Chen Li Yi | $1,300,000 | -- | |
| Staiano Louis T | -- | -- | |
| Henry Vincent E | -- | -- |
Source: Public Records
Mortgage History
| Date | Status | Borrower | Loan Amount |
|---|---|---|---|
| Open | Chen Li Yi | $480,000 |
Source: Public Records
Tax History Compared to Growth
Tax History
| Year | Tax Paid | Tax Assessment Tax Assessment Total Assessment is a certain percentage of the fair market value that is determined by local assessors to be the total taxable value of land and additions on the property. | Land | Improvement |
|---|---|---|---|---|
| 2025 | $9,067 | $79,560 | $23,040 | $56,520 |
| 2024 | $9,067 | $93,600 | $23,040 | $70,560 |
| 2023 | $9,088 | $91,320 | $23,040 | $68,280 |
| 2022 | $8,433 | $79,200 | $23,040 | $56,160 |
| 2021 | $8,392 | $76,080 | $23,040 | $53,040 |
| 2020 | $3,936 | $92,280 | $23,040 | $69,240 |
| 2019 | $7,870 | $102,060 | $23,040 | $79,020 |
| 2018 | $7,602 | $37,292 | $9,477 | $27,815 |
| 2017 | $7,176 | $35,202 | $11,623 | $23,579 |
| 2016 | $6,643 | $33,231 | $10,860 | $22,371 |
| 2015 | $3,580 | $31,351 | $13,887 | $17,464 |
| 2014 | $3,580 | $31,351 | $16,671 | $14,680 |
Source: Public Records
Map
Nearby Homes