729 Alecandro Daniel Ave Unit 2 North Las Vegas, NV 89031
Craig Ranch NeighborhoodEstimated Value: $361,255 - $384,000
3
Beds
2
Baths
1,318
Sq Ft
$284/Sq Ft
Est. Value
About This Home
This home is located at 729 Alecandro Daniel Ave Unit 2, North Las Vegas, NV 89031 and is currently estimated at $374,564, approximately $284 per square foot. 729 Alecandro Daniel Ave Unit 2 is a home located in Clark County with nearby schools including Fredric W. Watson Elementary School, Clifford O. Findlay Middle School, and Mojave High School.
Ownership History
Date
Name
Owned For
Owner Type
Purchase Details
Closed on
May 11, 2011
Sold by
Peterson Re Holdings Llc
Bought by
Flores Nelson E and Flores Zoila Y
Current Estimated Value
Purchase Details
Closed on
Apr 27, 2011
Sold by
Mejia Sandra
Bought by
Flores Nelson
Purchase Details
Closed on
Apr 26, 2011
Sold by
Sanchez Diego A
Bought by
Flores Zoila
Purchase Details
Closed on
Apr 21, 2011
Sold by
James William M and James Susan L
Bought by
Peterson Re Holdings Llc
Purchase Details
Closed on
Aug 31, 2006
Sold by
James Susan L
Bought by
James William M
Purchase Details
Closed on
May 12, 1999
Sold by
Pn Ii Inc
Bought by
James William M and James Susan L
Home Financials for this Owner
Home Financials are based on the most recent Mortgage that was taken out on this home.
Original Mortgage
$89,532
Interest Rate
6.94%
Create a Home Valuation Report for This Property
The Home Valuation Report is an in-depth analysis detailing your home's value as well as a comparison with similar homes in the area
Home Values in the Area
Average Home Value in this Area
Purchase History
| Date | Buyer | Sale Price | Title Company |
|---|---|---|---|
| Flores Nelson E | $72,300 | Fidelity National Title | |
| Flores Nelson | -- | Fidelity National Title | |
| Flores Zoila | -- | Fidelity National Title | |
| Flores Nuria | -- | Fidelity National Title | |
| Peterson Re Holdings Llc | $56,100 | None Available | |
| James William M | -- | None Available | |
| James William M | $112,000 | Lawyers Title |
Source: Public Records
Mortgage History
| Date | Status | Borrower | Loan Amount |
|---|---|---|---|
| Previous Owner | James William M | $89,532 |
Source: Public Records
Tax History Compared to Growth
Tax History
| Year | Tax Paid | Tax Assessment Tax Assessment Total Assessment is a certain percentage of the fair market value that is determined by local assessors to be the total taxable value of land and additions on the property. | Land | Improvement |
|---|---|---|---|---|
| 2025 | $1,443 | $80,419 | $29,400 | $51,019 |
| 2024 | $1,337 | $80,419 | $29,400 | $51,019 |
| 2023 | $1,337 | $75,138 | $26,950 | $48,188 |
| 2022 | $1,238 | $66,200 | $22,050 | $44,150 |
| 2021 | $1,145 | $61,466 | $19,600 | $41,866 |
| 2020 | $1,060 | $59,825 | $18,200 | $41,625 |
| 2019 | $994 | $56,884 | $15,750 | $41,134 |
| 2018 | $948 | $51,406 | $11,900 | $39,506 |
| 2017 | $1,705 | $50,816 | $10,850 | $39,966 |
| 2016 | $889 | $44,125 | $8,400 | $35,725 |
| 2015 | $886 | $32,139 | $5,950 | $26,189 |
| 2014 | $858 | $24,824 | $4,550 | $20,274 |
Source: Public Records
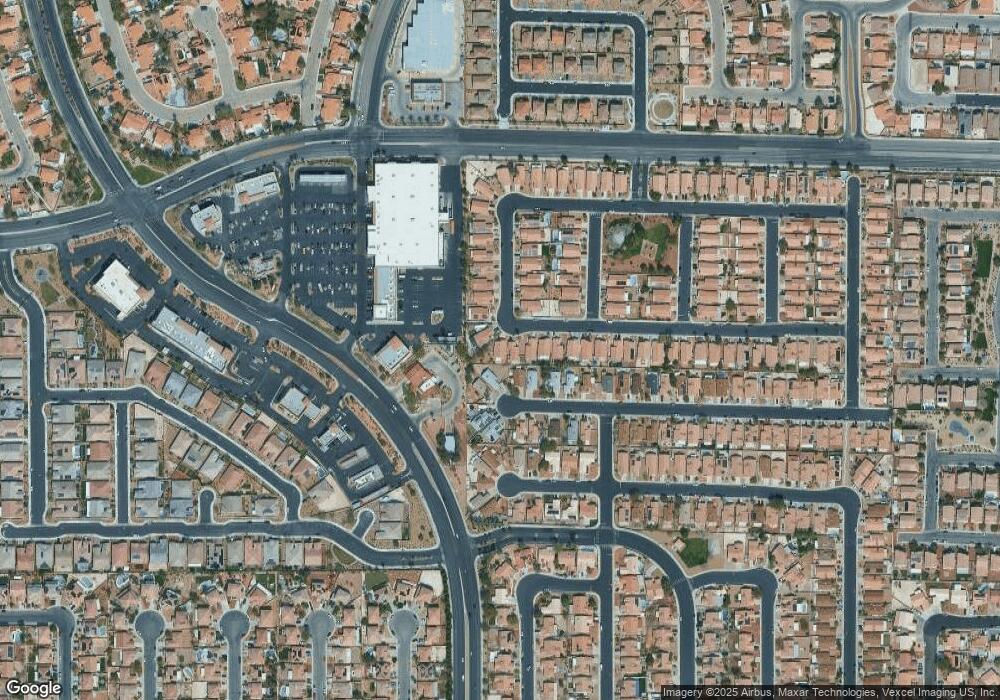
Map
Nearby Homes
- 5523 Jose Leon St
- 727 Roberta Alecia Ave
- 654 Roberta Alecia Ave
- 648 Carlos Julio Ave
- 621 Carlos Julio Ave
- 5717 Wizard Wand St
- 5517 Meridian Rain St
- 5313 Jeremy David St
- 5424 Kamilla Raen St
- 5625 Clay Ridge Rd
- 449 Orchid Oasis Ave
- 625 Bright Lights Ave
- 921 Evening Fawn Dr
- 5243 Edna Crane Ave
- 438 Shimmering Sands Ave
- 920 Grey Hollow Ave
- 5741 Copper Sun Ct
- 5808 Lone Song Rd
- 408 Colorful Rain Ave
- 1009 Nawkee Dr
- 5511 Jose Leon St
- 725 Alecandro Daniel Ave
- 725 Alecandro Daniel Ave Unit n/a
- 728 Roberta Alecia Ave
- 724 Roberta Alecia Ave
- 721 Alecandro Daniel Ave
- 732 Roberta Alecia Ave
- 5515 Jose Leon St Unit 2
- 717 Alecandro Daniel Ave
- 720 Roberta Alecia Ave
- 5519 Jose Leon St
- 5519 Jose Leon St Unit none
- 5516 Jose Leon St
- 713 Alecandro Daniel Ave
- 716 Roberta Alecia Ave
- 731 Roberta Alecia Ave
- 5520 Jose Leon St
- 709 Alecandro Daniel Ave Unit 2
- 723 Roberta Alecia Ave
- 712 Roberta Alecia Ave