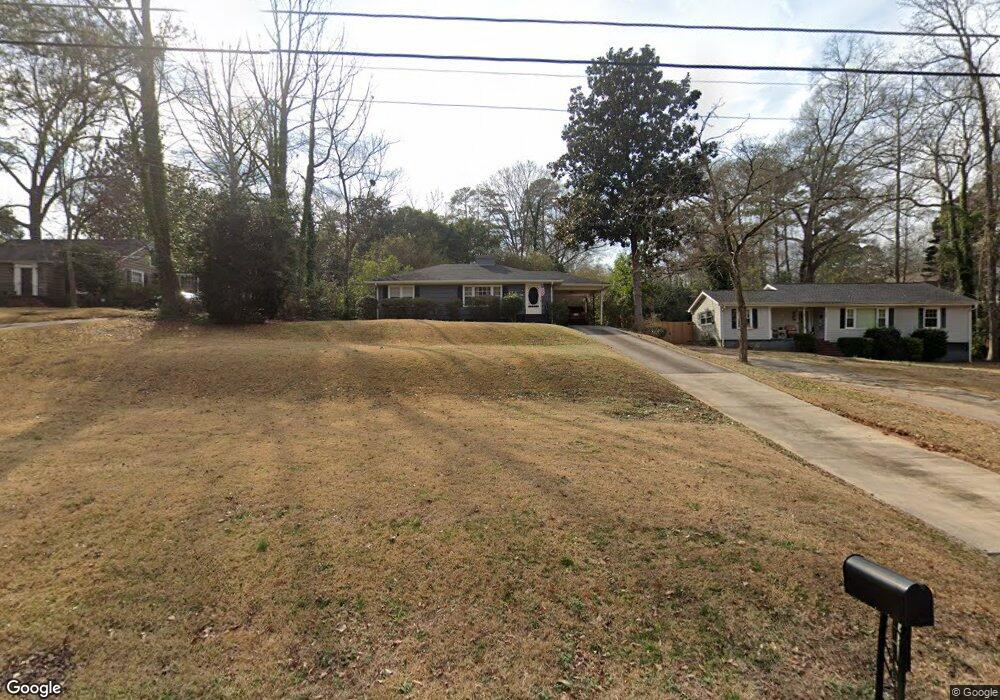
729 Clay St Griffin, GA 30224
Spalding County NeighborhoodEstimated Value: $175,931 - $203,000
2
Beds
1
Bath
1,176
Sq Ft
$163/Sq Ft
Est. Value
About This Home
This home is located at 729 Clay St, Griffin, GA 30224 and is currently estimated at $191,983, approximately $163 per square foot. 729 Clay St is a home located in Spalding County with nearby schools including Futral Road Elementary School, Rehoboth Road Middle School, and Spalding High School.
Ownership History
Date
Name
Owned For
Owner Type
Purchase Details
Closed on
Feb 28, 1995
Sold by
Ganswich Frank Sally
Bought by
Adams Grant and Salazer Paula
Current Estimated Value
Purchase Details
Closed on
Dec 21, 1990
Sold by
Ganswich William G and Ganswich Sara A
Bought by
Ganswich Sara Atkinson
Purchase Details
Closed on
Aug 10, 1987
Sold by
Mcdaniel William S and Mcdaniel Martha W
Bought by
Ganswich William G and Ganswich Sara A
Purchase Details
Closed on
Mar 5, 1987
Sold by
Mcdaniel Ruth Stokes
Bought by
Mcdaniel William S and Mcdaniel Martha W
Purchase Details
Closed on
Dec 13, 1968
Sold by
Mcdaniel William S
Bought by
Mcdaniel Ruth Stokes
Purchase Details
Closed on
Mar 1, 1967
Sold by
Lavender Harold W
Bought by
Mcdaniel William S
Purchase Details
Closed on
Aug 8, 1960
Bought by
Lavender Harold W
Create a Home Valuation Report for This Property
The Home Valuation Report is an in-depth analysis detailing your home's value as well as a comparison with similar homes in the area
Home Values in the Area
Average Home Value in this Area
Purchase History
| Date | Buyer | Sale Price | Title Company |
|---|---|---|---|
| Adams Grant | $59,900 | -- | |
| Ganswich Sara Atkinson | -- | -- | |
| Ganswich William G | $47,000 | -- | |
| Mcdaniel William S | -- | -- | |
| Mcdaniel Ruth Stokes | $15,000 | -- | |
| Mcdaniel William S | $3,300 | -- | |
| Lavender Harold W | $16,000 | -- |
Source: Public Records
Mortgage History
| Date | Status | Borrower | Loan Amount |
|---|---|---|---|
| Closed | Adams Grant | $0 |
Source: Public Records
Tax History
| Year | Tax Paid | Tax Assessment Tax Assessment Total Assessment is a certain percentage of the fair market value that is determined by local assessors to be the total taxable value of land and additions on the property. | Land | Improvement |
|---|---|---|---|---|
| 2025 | $1,796 | $52,928 | $10,000 | $42,928 |
| 2024 | $1,757 | $52,928 | $10,000 | $42,928 |
| 2023 | $1,933 | $52,928 | $10,000 | $42,928 |
| 2022 | $1,694 | $44,754 | $8,000 | $36,754 |
| 2021 | $1,547 | $41,054 | $8,000 | $33,054 |
| 2020 | $1,547 | $41,054 | $8,000 | $33,054 |
| 2019 | $1,090 | $29,130 | $8,800 | $20,330 |
| 2018 | $1,030 | $26,736 | $8,800 | $17,936 |
| 2017 | $969 | $25,811 | $8,800 | $17,011 |
| 2016 | $985 | $25,811 | $8,800 | $17,011 |
| 2015 | $1,001 | $25,811 | $8,800 | $17,011 |
| 2014 | $1,030 | $25,811 | $8,800 | $17,011 |
Source: Public Records
Map
Nearby Homes
- 729 Springer Dr
- 310 Terrace St
- 714 Maple Dr
- 711 Maple Dr
- 816 Woodland Dr
- 505 Kincaid Ave
- 306 Tilney Ave
- 159 Milner Ave
- 710 Hale Ave
- 922 Springer Dr
- 1099 Pine Valley Rd
- 923 Mockingbird Ln
- 550 S Hill St
- 123 Huntsman Dr
- 874 Crescent Ln Unit 52
- 859 Crescent Ln
- 861 Crescent Ln
- 517 S 6th St
- 1014 E College St
- 323 E College St
- 736 Clay St
- 723 Clay St
- 820 Hillcrest Ave
- 727 Clay St
- 816 Hillcrest Ave
- 618 Forrest Ave
- 620 Forrest Ave
- 731 Clay St
- 624 Forrest Ave
- 712 Springer Dr
- 840 Hillcrest Ave
- 628 Forrest Ave
- 722 Springer Dr
- 735 Clay St
- 735 Clay St Unit 174
- 702 Springer Dr
- 726 Springer Dr
- 632 Forrest Ave
- 728 Springer Dr
- 850 Hillcrest Ave
Your Personal Tour Guide
Ask me questions while you tour the home.