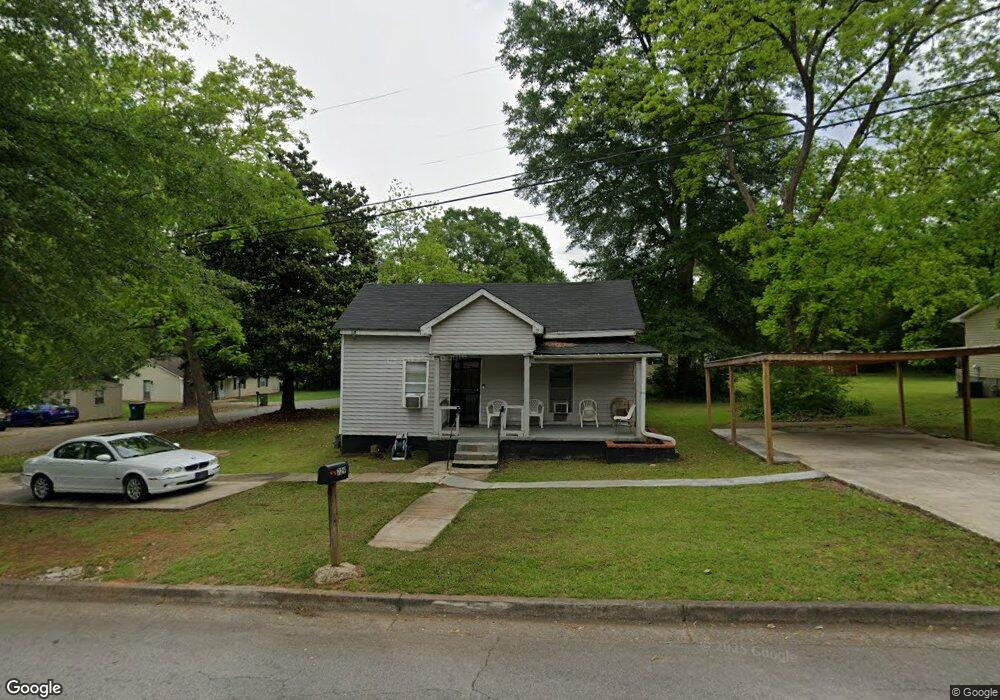
729 Fertilla St Carrollton, GA 30117
Estimated Value: $158,636 - $202,000
2
Beds
1
Bath
1,110
Sq Ft
$161/Sq Ft
Est. Value
About This Home
This home is located at 729 Fertilla St, Carrollton, GA 30117 and is currently estimated at $178,409, approximately $160 per square foot. 729 Fertilla St is a home located in Carroll County with nearby schools including Carrollton Elementary School, Carrollton Upper Elementary School, and Carrollton Middle School.
Ownership History
Date
Name
Owned For
Owner Type
Purchase Details
Closed on
Jan 13, 2006
Sold by
North Willie
Bought by
North Vic
Current Estimated Value
Purchase Details
Closed on
May 2, 1990
Sold by
North Willie and North Jerry
Bought by
North Willie
Purchase Details
Closed on
Jul 1, 1984
Sold by
Adams Addie Lue
Bought by
Graves Jimmie and Graves Richard
Purchase Details
Closed on
May 1, 1984
Sold by
Graves Jimmie and Graves Richard
Bought by
North Willie and North Jerry
Purchase Details
Closed on
Aug 20, 1978
Sold by
Adams Braddon
Bought by
Adams Adie Lue
Create a Home Valuation Report for This Property
The Home Valuation Report is an in-depth analysis detailing your home's value as well as a comparison with similar homes in the area
Home Values in the Area
Average Home Value in this Area
Purchase History
| Date | Buyer | Sale Price | Title Company |
|---|---|---|---|
| North Vic | -- | -- | |
| North Willie | -- | -- | |
| Graves Jimmie | $13,000 | -- | |
| North Willie | $5,000 | -- | |
| Adams Adie Lue | -- | -- |
Source: Public Records
Tax History Compared to Growth
Tax History
| Year | Tax Paid | Tax Assessment Tax Assessment Total Assessment is a certain percentage of the fair market value that is determined by local assessors to be the total taxable value of land and additions on the property. | Land | Improvement |
|---|---|---|---|---|
| 2024 | $219 | $39,141 | $7,467 | $31,674 |
| 2023 | $202 | $36,362 | $7,468 | $28,894 |
| 2022 | $196 | $28,339 | $4,969 | $23,370 |
| 2021 | $145 | $20,925 | $3,675 | $17,250 |
| 2020 | $137 | $19,069 | $3,675 | $15,394 |
| 2019 | $518 | $17,565 | $3,675 | $13,890 |
| 2018 | $469 | $15,665 | $3,675 | $11,990 |
| 2017 | $471 | $15,665 | $3,675 | $11,990 |
| 2016 | $474 | $15,665 | $3,675 | $11,990 |
| 2015 | $277 | $8,974 | $2,464 | $6,510 |
| 2014 | $278 | $8,974 | $2,464 | $6,510 |
Source: Public Records
Map
Nearby Homes
- 406 Harmon Ave
- 105 Mara St
- 423 Clifton Terrace
- 150 Adamson Dr
- 114 Bennett Cir
- 509 Adamson Ave
- 521 Adamson Ave
- 317 Bledsoe St
- 27 South St
- 214 Lane Dr
- 212 Lane Dr Unit LOT 60
- 212 Lane Dr
- 210 Lane Dr Unit LOT 61
- 210 Lane Dr
- 216 Lane Dr
- 202 Laney Dr
- 112 Lane Dr
- 112 Lane Dr Unit LOT 68
- 322 Cedar St
- 301 Bradley St