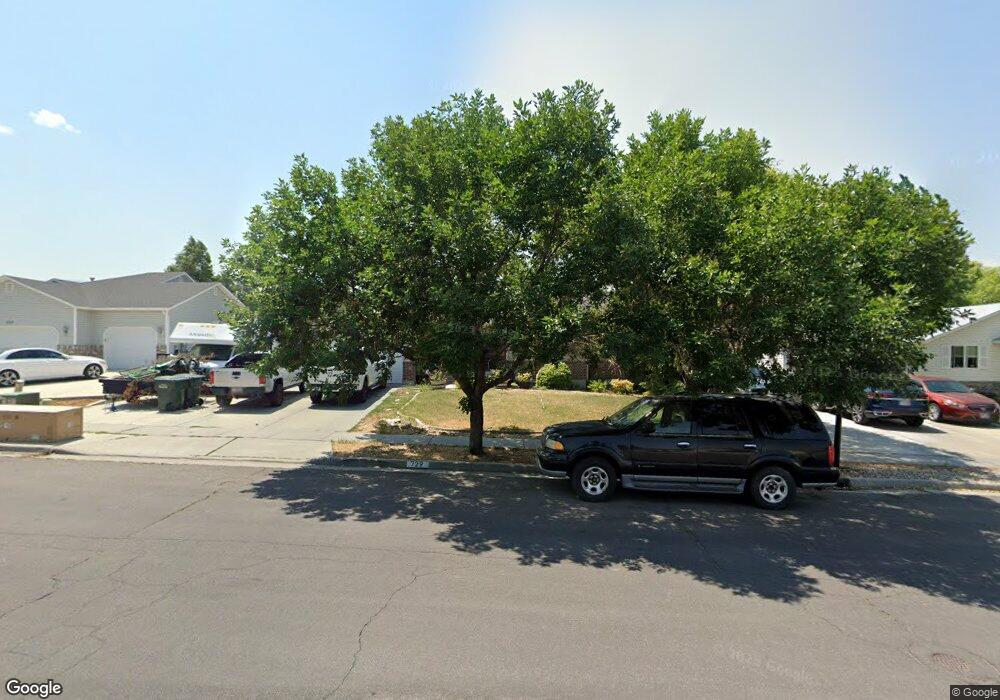
729 Fox Run Dr Tooele, UT 84074
Estimated Value: $459,000 - $509,283
5
Beds
4
Baths
3,152
Sq Ft
$152/Sq Ft
Est. Value
About This Home
This home is located at 729 Fox Run Dr, Tooele, UT 84074 and is currently estimated at $479,571, approximately $152 per square foot. 729 Fox Run Dr is a home located in Tooele County with nearby schools including Middle Canyon Elementary School, Tooele Junior High School, and Tooele High School.
Ownership History
Date
Name
Owned For
Owner Type
Purchase Details
Closed on
Nov 7, 2020
Sold by
Wilson Charles Patterson
Bought by
Wilson Charles Patterson and Wilson Ashley
Current Estimated Value
Home Financials for this Owner
Home Financials are based on the most recent Mortgage that was taken out on this home.
Original Mortgage
$341,050
Outstanding Balance
$303,486
Interest Rate
2.8%
Mortgage Type
VA
Estimated Equity
$176,085
Purchase Details
Closed on
Dec 17, 2019
Sold by
Parris Holli A
Bought by
Wilson Charles Patterson
Home Financials for this Owner
Home Financials are based on the most recent Mortgage that was taken out on this home.
Original Mortgage
$333,500
Interest Rate
3.6%
Mortgage Type
VA
Purchase Details
Closed on
May 29, 2012
Sold by
Parris Holli A
Bought by
Parris Holli A
Create a Home Valuation Report for This Property
The Home Valuation Report is an in-depth analysis detailing your home's value as well as a comparison with similar homes in the area
Home Values in the Area
Average Home Value in this Area
Purchase History
| Date | Buyer | Sale Price | Title Company |
|---|---|---|---|
| Wilson Charles Patterson | -- | Servicelink | |
| Wilson Charles Patterson | -- | Metro National Title | |
| Parris Holli A | -- | Title One |
Source: Public Records
Mortgage History
| Date | Status | Borrower | Loan Amount |
|---|---|---|---|
| Open | Wilson Charles Patterson | $341,050 | |
| Closed | Wilson Charles Patterson | $333,500 |
Source: Public Records
Tax History Compared to Growth
Tax History
| Year | Tax Paid | Tax Assessment Tax Assessment Total Assessment is a certain percentage of the fair market value that is determined by local assessors to be the total taxable value of land and additions on the property. | Land | Improvement |
|---|---|---|---|---|
| 2025 | -- | $263,186 | $59,813 | $203,373 |
| 2024 | -- | $263,778 | $59,813 | $203,965 |
| 2023 | $0 | $278,350 | $56,955 | $221,395 |
| 2022 | $1,137 | $268,207 | $57,321 | $210,886 |
| 2021 | $274 | $185,148 | $22,928 | $162,220 |
| 2020 | $69 | $305,032 | $41,688 | $263,344 |
| 2019 | $2,108 | $258,819 | $41,688 | $217,131 |
| 2018 | $1,967 | $229,009 | $45,000 | $184,009 |
| 2017 | $1,769 | $244,339 | $30,000 | $214,339 |
| 2016 | $1,436 | $119,010 | $16,500 | $102,510 |
| 2015 | $1,436 | $104,432 | $0 | $0 |
| 2014 | -- | $104,432 | $0 | $0 |
Source: Public Records
Map
Nearby Homes
- 731 Fox Run Dr
- 727 Fox Run Dr
- 733 Fox Run Dr
- 725 Fox Run Dr
- 788 Left Hand Fork Dr
- 723 Fox Run Dr
- 735 Fox Run Dr
- 779 Left Hand Fork Dr
- 722 Fox Run Dr
- 789 Left Hand Fork Dr
- 801 Valley View Dr
- 721 Fox Run Dr
- 808 Left Hand Fork Dr
- 737 Fox Run Dr
- 797 Valley View Dr
- 793 Valley View Dr
- 789 Valley View Dr
- 822 Left Hand Fork Dr
- 805 Valley View Dr
- 805 Left Hand Fork Dr