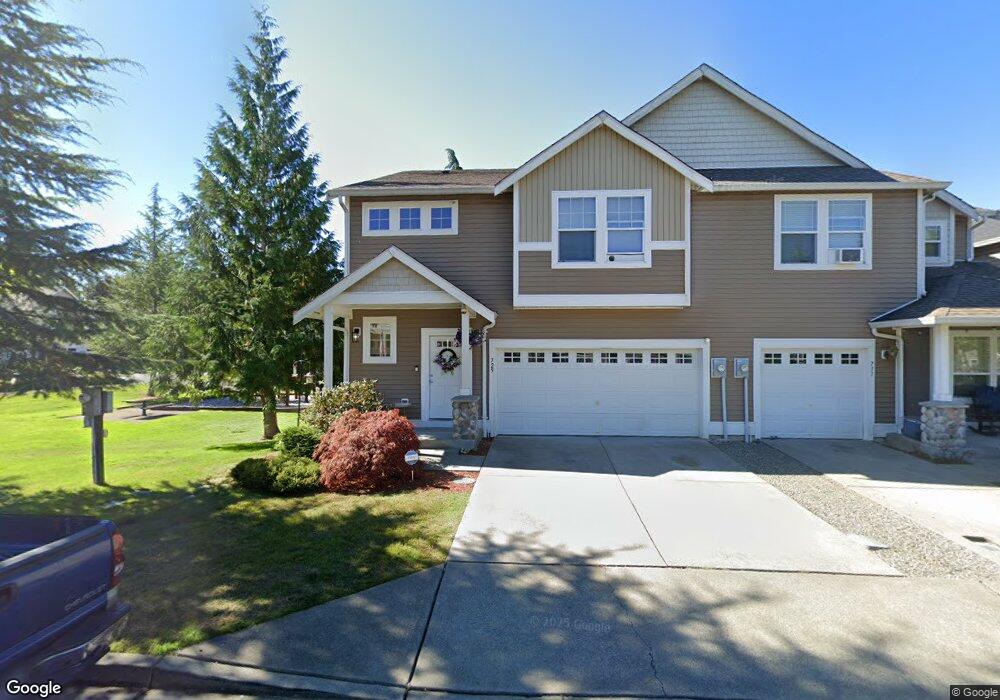
729 Glenmore Loop Port Orchard, WA 98366
Estimated Value: $480,000 - $546,000
3
Beds
3
Baths
2,279
Sq Ft
$221/Sq Ft
Est. Value
About This Home
This home is located at 729 Glenmore Loop, Port Orchard, WA 98366 and is currently estimated at $503,127, approximately $220 per square foot. 729 Glenmore Loop is a home located in Kitsap County with nearby schools including East Port Orchard Elementary School, Marcus Whitman Middle School, and South Kitsap High School.
Ownership History
Date
Name
Owned For
Owner Type
Purchase Details
Closed on
May 25, 2006
Sold by
Capstone Homes Inc
Bought by
Bradwell Michelle
Current Estimated Value
Home Financials for this Owner
Home Financials are based on the most recent Mortgage that was taken out on this home.
Original Mortgage
$222,400
Outstanding Balance
$129,687
Interest Rate
6.52%
Mortgage Type
Fannie Mae Freddie Mac
Estimated Equity
$373,440
Create a Home Valuation Report for This Property
The Home Valuation Report is an in-depth analysis detailing your home's value as well as a comparison with similar homes in the area
Home Values in the Area
Average Home Value in this Area
Purchase History
| Date | Buyer | Sale Price | Title Company |
|---|---|---|---|
| Bradwell Michelle | $278,280 | Transnation Title |
Source: Public Records
Mortgage History
| Date | Status | Borrower | Loan Amount |
|---|---|---|---|
| Open | Bradwell Michelle | $222,400 |
Source: Public Records
Tax History Compared to Growth
Tax History
| Year | Tax Paid | Tax Assessment Tax Assessment Total Assessment is a certain percentage of the fair market value that is determined by local assessors to be the total taxable value of land and additions on the property. | Land | Improvement |
|---|---|---|---|---|
| 2026 | $3,723 | $427,430 | $54,440 | $372,990 |
| 2025 | $3,723 | $426,610 | $53,620 | $372,990 |
| 2024 | $3,594 | $426,610 | $53,620 | $372,990 |
| 2023 | $3,590 | $426,610 | $53,620 | $372,990 |
| 2022 | $3,493 | $349,410 | $50,070 | $299,340 |
| 2021 | $3,115 | $295,320 | $46,530 | $248,790 |
| 2020 | $3,070 | $282,290 | $44,310 | $237,980 |
| 2019 | $2,658 | $267,550 | $54,020 | $213,530 |
| 2018 | $2,797 | $188,760 | $46,970 | $141,790 |
| 2017 | $2,069 | $188,760 | $46,970 | $141,790 |
| 2016 | $1,995 | $168,510 | $46,970 | $121,540 |
| 2015 | $1,923 | $165,130 | $46,970 | $118,160 |
| 2014 | -- | $197,200 | $46,970 | $150,230 |
| 2013 | -- | $202,100 | $52,040 | $150,060 |
Source: Public Records
Map
Nearby Homes
- 2949 SE Mile Hill Dr Unit C-2
- 4990 Mile Hill Dr
- 190 SE Mile Hill Dr
- 0 Wendell Ave SE
- 3589 SE Pine Tree Dr
- 123 E 4th St
- 3817 SE Horstman Rd
- 1663 Harrison Ave SE
- 1703 Harrison Ave SE
- 3900 SE Mile Hill Dr
- 4010 SE Lovell St
- 3930 SE Mile Hill Dr
- 3140 E Washington St
- 4233 SE Horsehead Way
- 0 E Washington St Unit NWM2337936
- 22 Lots E Washington St
- 4 SE Sinclair View Dr
- 0 Beach Dr E Unit NWM2448019
- 0 Beach Dr E Unit NWM2139946
- 4305 SE Elijah Ct
- 2993 Huntington St
- 735 Glenmore Loop
- 734 Glenmore Loop
- 732 Glenmore Loop
- 2991 Huntington St
- 736 Glenmore Loop
- 730 Glenmore Loop
- 2889 Huntington St
- 2988 Sprague St
- 2996 Huntington St
- 2994 Huntington St
- 2998 Huntington St
- 3000 Huntington St
- 2887 Huntington St
- 2990 Sprague St
- 3002 Huntington St
- 2992 Huntington St
- 2984 Sprague St