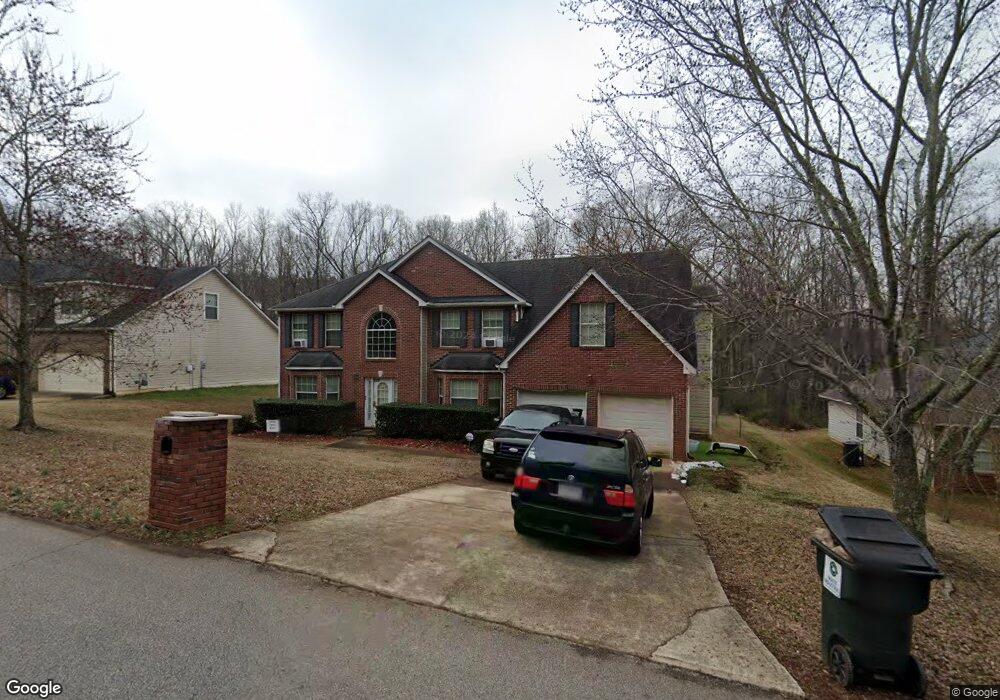
729 Knox Springs Rd Austell, GA 30168
Estimated Value: $370,498 - $437,000
4
Beds
2
Baths
3,236
Sq Ft
$126/Sq Ft
Est. Value
About This Home
This home is located at 729 Knox Springs Rd, Austell, GA 30168 and is currently estimated at $407,125, approximately $125 per square foot. 729 Knox Springs Rd is a home located in Cobb County with nearby schools including Bryant Elementary School, Lindley Middle School, and Pebblebrook High School.
Ownership History
Date
Name
Owned For
Owner Type
Purchase Details
Closed on
Aug 23, 2010
Sold by
Hud & Housing Of Urban Dev
Bought by
Henry Cynthia
Current Estimated Value
Home Financials for this Owner
Home Financials are based on the most recent Mortgage that was taken out on this home.
Original Mortgage
$183,419
Outstanding Balance
$122,539
Interest Rate
4.75%
Mortgage Type
FHA
Estimated Equity
$284,586
Purchase Details
Closed on
Mar 2, 2010
Sold by
Suntrust Mtg Inc
Bought by
Hud-Housing Of Urban Dev
Purchase Details
Closed on
Sep 30, 2004
Sold by
Legacy Communities Of Knox Spring
Bought by
Johnson Sherman N
Home Financials for this Owner
Home Financials are based on the most recent Mortgage that was taken out on this home.
Original Mortgage
$204,950
Interest Rate
5.71%
Mortgage Type
VA
Create a Home Valuation Report for This Property
The Home Valuation Report is an in-depth analysis detailing your home's value as well as a comparison with similar homes in the area
Home Values in the Area
Average Home Value in this Area
Purchase History
| Date | Buyer | Sale Price | Title Company |
|---|---|---|---|
| Henry Cynthia | $175,000 | -- | |
| Hud-Housing Of Urban Dev | -- | -- | |
| Suntrust Mtg Inc | $237,440 | -- | |
| Johnson Sherman N | $207,200 | -- |
Source: Public Records
Mortgage History
| Date | Status | Borrower | Loan Amount |
|---|---|---|---|
| Open | Henry Cynthia | $183,419 | |
| Previous Owner | Johnson Sherman N | $204,950 |
Source: Public Records
Tax History Compared to Growth
Tax History
| Year | Tax Paid | Tax Assessment Tax Assessment Total Assessment is a certain percentage of the fair market value that is determined by local assessors to be the total taxable value of land and additions on the property. | Land | Improvement |
|---|---|---|---|---|
| 2025 | $5,219 | $173,204 | $42,000 | $131,204 |
| 2024 | $5,418 | $179,700 | $32,000 | $147,700 |
| 2023 | $4,039 | $133,960 | $12,000 | $121,960 |
| 2022 | $4,066 | $133,960 | $12,000 | $121,960 |
| 2021 | $2,949 | $97,168 | $12,000 | $85,168 |
| 2020 | $2,949 | $97,168 | $12,000 | $85,168 |
| 2019 | $2,671 | $88,016 | $10,000 | $78,016 |
| 2018 | $2,671 | $88,016 | $10,000 | $78,016 |
| 2017 | $2,257 | $78,516 | $10,000 | $68,516 |
| 2016 | $1,839 | $63,980 | $8,000 | $55,980 |
| 2015 | $1,885 | $63,980 | $8,000 | $55,980 |
| 2014 | $1,297 | $43,640 | $0 | $0 |
Source: Public Records
Map
Nearby Homes
- 761 Knox Springs Rd
- 7151 Springchase Way
- 760 Wade Farm Dr
- 796 Crestside Ct Unit 1
- 7282 Rockhouse Rd Unit 5
- 7249 Factory Shoals Rd
- Townhomes at Crestview Floorplan at Crestview - Townhomes
- 7224 Crestside Dr Unit 1
- 7238 Crestside Dr Unit 79
- 6914 Fairway Trail
- 937 Pine Oak Trail
- 967 Pine Hollow Rd
- 7098 Pleasant Dr
- 7063 Pleasant Dr
- 7067 Pleasant Dr
- 760 W Starling Dr SW
- 7010 Oakhill Cir
- 6837 Shenandoah Trail
- 721 Knox Springs Rd
- 737 Knox Springs Rd
- 713 Knox Springs Rd
- 730 Knox Springs Rd Unit 1
- 720 Knox Springs Rd Unit I
- 705 Knox Springs Rd
- 740 Knox Springs Rd
- 700 Knox Springs Rd
- 800 Knox Springs Rd
- 0 Knox Springs Rd Unit 8897841
- 0 Knox Springs Rd Unit 3216410
- 0 Knox Springs Rd Unit 7054310
- 0 Knox Springs Rd Unit 8656925
- 691 Knox Springs Rd
- 632 Tomahawk Place
- 632 Tomahawk Place
- 632 Tomahawk Place
- 746 Knox Springs Rd
- 690 Knox Springs Rd
- 0 Tomahawk Place SW Unit 3168419