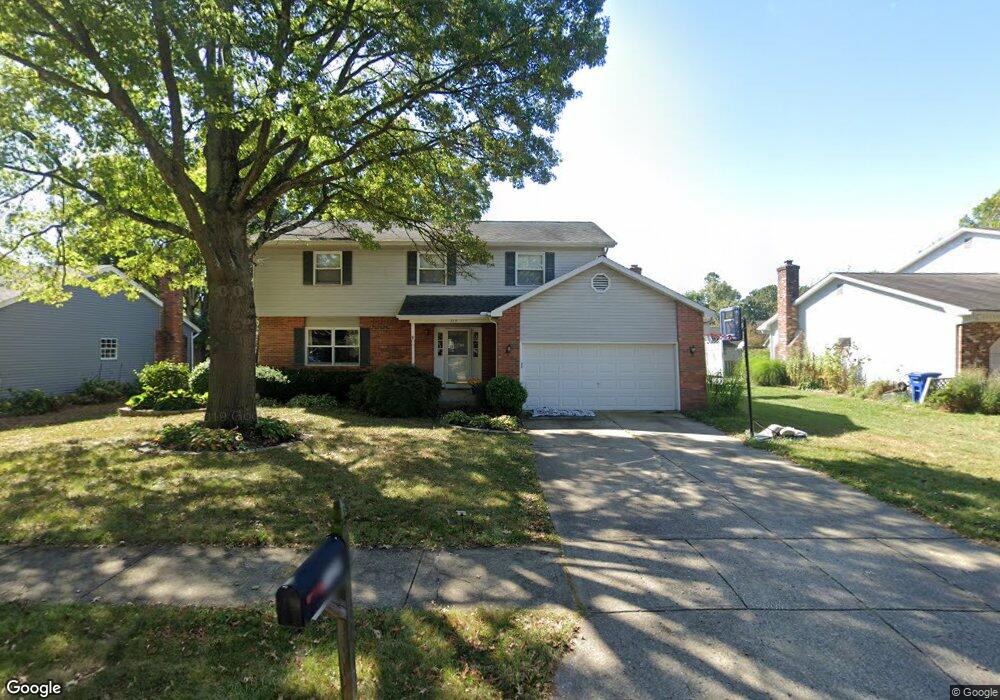
729 Linncrest Dr Westerville, OH 43081
Estimated Value: $448,794 - $529,000
4
Beds
3
Baths
2,552
Sq Ft
$189/Sq Ft
Est. Value
About This Home
This home is located at 729 Linncrest Dr, Westerville, OH 43081 and is currently estimated at $483,449, approximately $189 per square foot. 729 Linncrest Dr is a home located in Franklin County with nearby schools including Mark Twain Elementary School, Walnut Springs Middle School, and Westerville-North High School.
Ownership History
Date
Name
Owned For
Owner Type
Purchase Details
Closed on
Jul 8, 2010
Sold by
Bernsdorf Chad S and Bernsdorf Jennifer D
Bought by
Fouse Samuel E
Current Estimated Value
Home Financials for this Owner
Home Financials are based on the most recent Mortgage that was taken out on this home.
Original Mortgage
$201,289
Interest Rate
4.75%
Mortgage Type
FHA
Purchase Details
Closed on
Jun 28, 2002
Sold by
Fate James F and Fate Judith A
Bought by
Bernsdorf Chad S and Bernsdorf Jennifer D
Home Financials for this Owner
Home Financials are based on the most recent Mortgage that was taken out on this home.
Original Mortgage
$185,000
Interest Rate
6.82%
Mortgage Type
Purchase Money Mortgage
Purchase Details
Closed on
Oct 26, 1994
Sold by
Noll William
Bought by
Fate James F and Fate Judith A
Home Financials for this Owner
Home Financials are based on the most recent Mortgage that was taken out on this home.
Original Mortgage
$114,000
Interest Rate
8.5%
Mortgage Type
New Conventional
Purchase Details
Closed on
Jul 1, 1979
Create a Home Valuation Report for This Property
The Home Valuation Report is an in-depth analysis detailing your home's value as well as a comparison with similar homes in the area
Home Values in the Area
Average Home Value in this Area
Purchase History
| Date | Buyer | Sale Price | Title Company |
|---|---|---|---|
| Fouse Samuel E | $204,000 | Talon Group | |
| Bernsdorf Chad S | $194,800 | Chicago Title | |
| Fate James F | $142,500 | -- | |
| -- | $79,400 | -- |
Source: Public Records
Mortgage History
| Date | Status | Borrower | Loan Amount |
|---|---|---|---|
| Previous Owner | Fouse Samuel E | $201,289 | |
| Previous Owner | Bernsdorf Chad S | $185,000 | |
| Previous Owner | Fate James F | $114,000 |
Source: Public Records
Tax History Compared to Growth
Tax History
| Year | Tax Paid | Tax Assessment Tax Assessment Total Assessment is a certain percentage of the fair market value that is determined by local assessors to be the total taxable value of land and additions on the property. | Land | Improvement |
|---|---|---|---|---|
| 2024 | $6,586 | $115,890 | $30,660 | $85,230 |
| 2023 | $6,447 | $115,890 | $30,660 | $85,230 |
| 2022 | $6,941 | $95,270 | $17,290 | $77,980 |
| 2021 | $6,999 | $95,270 | $17,290 | $77,980 |
| 2020 | $6,979 | $95,270 | $17,290 | $77,980 |
| 2019 | $5,712 | $73,610 | $17,290 | $56,320 |
| 2018 | $5,636 | $73,610 | $17,290 | $56,320 |
| 2017 | $5,618 | $73,610 | $17,290 | $56,320 |
| 2016 | $5,857 | $69,860 | $17,430 | $52,430 |
| 2015 | $5,673 | $69,860 | $17,430 | $52,430 |
| 2014 | $5,677 | $69,860 | $17,430 | $52,430 |
| 2013 | $2,700 | $66,535 | $16,590 | $49,945 |
Source: Public Records
Map
Nearby Homes
- 768 Collingwood Dr
- 192 Buckeye Ct
- 589 E College Ave
- 182 Hillcrest Dr
- 200 Matthew Ave
- 150 Matthew Ave
- 912 Lakeway Ct E
- 417 E Park St
- 90 Spring Creek Dr
- 368 E College Ave
- 364 E College Ave
- 371 Delaware Dr
- 974 Lakeland Dr
- 718 Sugar Ct
- 969 Farrington Dr
- 360 Potawatomi Dr
- 73 Keethler Dr S
- 539 Cherrington Rd
- 0 Cherrington Rd Unit 225023909
- 199 E College Ave
- 741 Linncrest Dr
- 721 Linncrest Dr
- 728 Collingwood Dr
- 740 Collingwood Dr
- 720 Collingwood Dr
- 749 Linncrest Dr
- 711 Linncrest Dr
- 726 Linncrest Dr
- 718 Linncrest Dr
- 738 Linncrest Dr
- 748 Collingwood Dr
- 710 Collingwood Dr
- 60 Collingwood Dr
- 746 Linncrest Dr
- 757 Linncrest Dr
- 708 Linncrest Dr
- 703 Linncrest Dr
- 756 Collingwood Dr
- 44 Gladale Dr
- 10 Gladale Dr