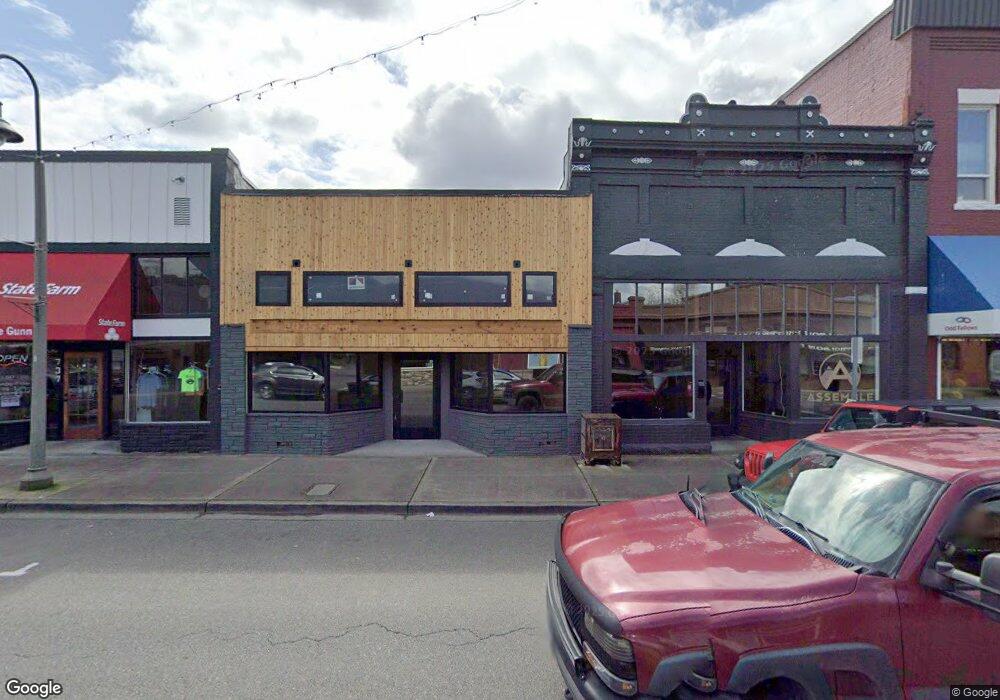
729 Main St Buckley, WA 98321
Estimated Value: $157,092
--
Bed
--
Bath
2,075
Sq Ft
$76/Sq Ft
Est. Value
About This Home
This home is located at 729 Main St, Buckley, WA 98321 and is currently estimated at $157,092, approximately $75 per square foot. 729 Main St is a home located in Pierce County with nearby schools including Elk Ridge Elementary School, Glacier Middle School, and Cascade Independent High School.
Ownership History
Date
Name
Owned For
Owner Type
Purchase Details
Closed on
Mar 15, 2022
Sold by
Beach and Kim
Bought by
Johansen Jalen and Johansen Sarah
Current Estimated Value
Purchase Details
Closed on
Aug 26, 1996
Sold by
Fennell Mark
Bought by
Beach Ted and Beach Kim
Home Financials for this Owner
Home Financials are based on the most recent Mortgage that was taken out on this home.
Original Mortgage
$49,436
Interest Rate
8.23%
Mortgage Type
Commercial
Purchase Details
Closed on
Aug 13, 1996
Sold by
Covey Glen A
Bought by
Tycz John and Tycz Bonnis
Home Financials for this Owner
Home Financials are based on the most recent Mortgage that was taken out on this home.
Original Mortgage
$49,436
Interest Rate
8.23%
Mortgage Type
Commercial
Create a Home Valuation Report for This Property
The Home Valuation Report is an in-depth analysis detailing your home's value as well as a comparison with similar homes in the area
Home Values in the Area
Average Home Value in this Area
Purchase History
| Date | Buyer | Sale Price | Title Company |
|---|---|---|---|
| Johansen Jalen | $150,000 | Old Republic Title | |
| Beach Ted | $64,650 | Chicago Title | |
| Tycz John | -- | -- |
Source: Public Records
Mortgage History
| Date | Status | Borrower | Loan Amount |
|---|---|---|---|
| Previous Owner | Beach Ted | $49,436 |
Source: Public Records
Tax History Compared to Growth
Tax History
| Year | Tax Paid | Tax Assessment Tax Assessment Total Assessment is a certain percentage of the fair market value that is determined by local assessors to be the total taxable value of land and additions on the property. | Land | Improvement |
|---|---|---|---|---|
| 2025 | $1,491 | $207,600 | $78,200 | $129,400 |
| 2024 | $1,491 | $156,900 | $75,700 | $81,200 |
| 2023 | $1,491 | $162,100 | $75,700 | $86,400 |
| 2022 | $1,584 | $153,500 | $75,700 | $77,800 |
| 2021 | $0 | $151,200 | $62,600 | $88,600 |
| 2019 | $1,635 | $168,300 | $69,800 | $98,500 |
| 2018 | $1,878 | $142,100 | $81,200 | $60,900 |
| 2017 | $1,789 | $141,800 | $73,500 | $68,300 |
| 2016 | $2,148 | $135,000 | $73,500 | $61,500 |
| 2014 | $2,334 | $135,000 | $73,500 | $61,500 |
| 2013 | $2,334 | $135,000 | $73,500 | $61,500 |
Source: Public Records
Map
Nearby Homes