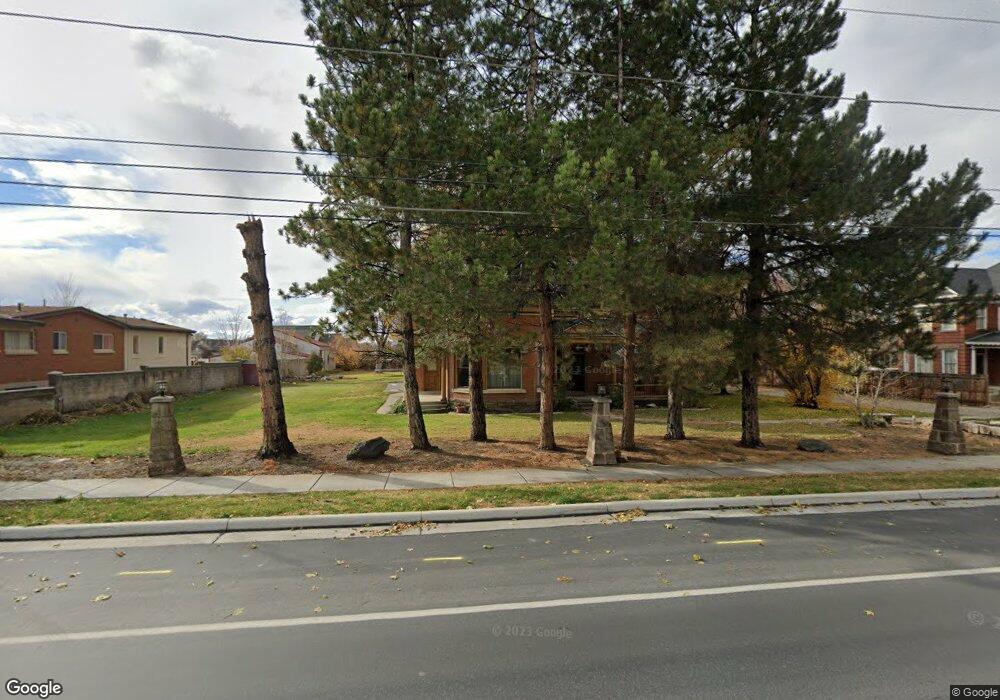
729 N 800 W West Bountiful, UT 84087
Estimated Value: $784,000 - $1,234,000
4
Beds
3
Baths
3,129
Sq Ft
$296/Sq Ft
Est. Value
About This Home
This home is located at 729 N 800 W, West Bountiful, UT 84087 and is currently estimated at $925,966, approximately $295 per square foot. 729 N 800 W is a home located in Davis County with nearby schools including West Bountiful Elementary School, Bountiful Junior High School, and Viewmont High School.
Ownership History
Date
Name
Owned For
Owner Type
Purchase Details
Closed on
Apr 13, 2025
Sold by
Jorgensen Bryce G
Bought by
Jorgensen Cindy A
Current Estimated Value
Purchase Details
Closed on
Jul 26, 2007
Sold by
Clayton Beverly A
Bought by
Jorgensen Bryce G and Jorgensen Cindy A
Purchase Details
Closed on
Jan 17, 2006
Sold by
Jorgensen Bryce G and Jorgensen Cindy A
Bought by
Jorgensen Bryce
Home Financials for this Owner
Home Financials are based on the most recent Mortgage that was taken out on this home.
Original Mortgage
$387,000
Interest Rate
6.28%
Mortgage Type
Fannie Mae Freddie Mac
Purchase Details
Closed on
Apr 1, 2002
Sold by
Jorgensen Bryce G and Jorgensen Cindy A
Bought by
Jorgensen Bryce G and Jorgensen Cindy A
Home Financials for this Owner
Home Financials are based on the most recent Mortgage that was taken out on this home.
Original Mortgage
$180,000
Interest Rate
6.31%
Create a Home Valuation Report for This Property
The Home Valuation Report is an in-depth analysis detailing your home's value as well as a comparison with similar homes in the area
Home Values in the Area
Average Home Value in this Area
Purchase History
| Date | Buyer | Sale Price | Title Company |
|---|---|---|---|
| Jorgensen Cindy A | -- | Trident Title | |
| Jorgensen Bryce G | -- | Aspen Title Insurance | |
| Jorgensen Bryce | -- | Aspen Title Insurance Agency | |
| Jorgensen Bryce G | -- | Western States Title Company |
Source: Public Records
Mortgage History
| Date | Status | Borrower | Loan Amount |
|---|---|---|---|
| Previous Owner | Jorgensen Bryce | $387,000 | |
| Previous Owner | Jorgensen Bryce G | $180,000 |
Source: Public Records
Tax History Compared to Growth
Tax History
| Year | Tax Paid | Tax Assessment Tax Assessment Total Assessment is a certain percentage of the fair market value that is determined by local assessors to be the total taxable value of land and additions on the property. | Land | Improvement |
|---|---|---|---|---|
| 2025 | $4,954 | $385,210 | $244,300 | $140,910 |
| 2024 | $4,709 | $370,278 | $206,840 | $163,438 |
| 2023 | $4,571 | $649,000 | $357,358 | $291,642 |
| 2022 | $4,695 | $375,100 | $191,721 | $183,379 |
| 2021 | $4,296 | $541,000 | $300,701 | $240,299 |
| 2020 | $3,065 | $451,000 | $244,774 | $206,226 |
| 2019 | $3,224 | $435,000 | $222,818 | $212,182 |
| 2018 | $3,280 | $386,000 | $191,130 | $194,870 |
| 2016 | $3,223 | $201,150 | $93,976 | $107,174 |
| 2015 | $2,415 | $174,585 | $93,976 | $80,609 |
| 2014 | $2,044 | $151,045 | $93,976 | $57,069 |
| 2013 | -- | $157,986 | $54,863 | $103,123 |
Source: Public Records
Map
Nearby Homes
- 825 W 1320 N
- 767 W 220 N
- 280 N 1100 W
- 790 N 500 W
- 340 N 500 W Unit 204
- 366 W 1000 N
- 399 W 400 N Unit 47
- 1520 N 550 W
- 680 W 500 S Unit 22
- 680 W 500 S Unit 17
- 1084 W Audrey Ln Unit 20
- 1084 W Audrey Ln
- Hampton Traditional Plan at Belmont Farms
- 499 N 200 W Unit 30
- 499 N 200 W Unit 19
- 553 N 200 W
- 789 W 1950 N
- 314 W Center St Unit D159
- 314 W Center St Unit E150
- 1503 N 300 W
- 705 N 800 W
- 739 N 800 W
- 675 N 800 W
- 752 N 800 W
- 730 N 800 W
- 702 N 800 W
- 788 N 800 W
- 795 N 800 W
- 835 W Heritage Point Ln Unit 19
- 829 Heritage Point Cir
- 838 W Heritage Point Cir Unit 32
- 771 N 800 W
- 647 N 800 W
- 666 N 800 W
- 740 N 800 W
- 808 N Vintage Cir
- 626 N 800 W
- 841 W Heritage Point Cir
- 850 W Heritage Point Cir
- 595 N 800 W