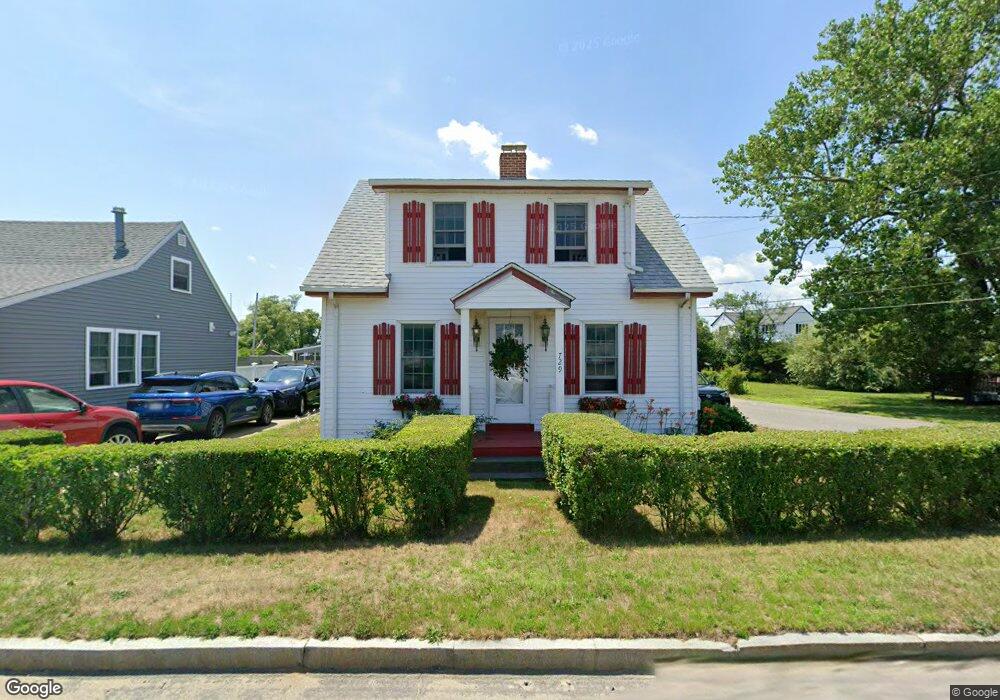
729 Ocean St Marshfield, MA 02050
Ocean Bluff-Brant Rock NeighborhoodEstimated Value: $558,129 - $687,000
3
Beds
1
Bath
1,296
Sq Ft
$473/Sq Ft
Est. Value
About This Home
This home is located at 729 Ocean St, Marshfield, MA 02050 and is currently estimated at $612,782, approximately $472 per square foot. 729 Ocean St is a home with nearby schools including Daniel Webster, Furnace Brook Middle School, and Marshfield High School.
Ownership History
Date
Name
Owned For
Owner Type
Purchase Details
Closed on
Jun 28, 2024
Sold by
Konetzny Ft and Konetzny
Bought by
Konetzny Int and Konetzny K
Current Estimated Value
Purchase Details
Closed on
Jun 26, 2024
Sold by
Pj Kinetzny Nt and Konetzny
Bought by
Konetzny Int and Konetzny K
Purchase Details
Closed on
Jan 31, 2019
Sold by
Konetzny Thomas J
Bought by
Konetzny Int and Konetzny K
Purchase Details
Closed on
Apr 25, 2018
Sold by
Konetzny Robert T and Konetzny Karen
Bought by
Konetzny Ft and Konetzny
Purchase Details
Closed on
Feb 6, 2018
Sold by
Konetzny Paul E
Bought by
Pj Konetzny Nt and Konetzny
Purchase Details
Closed on
Jan 17, 2018
Sold by
Mary R Konetzny Lt and Konetzny
Bought by
Konetzny Paul E and Konetny Thomas J
Purchase Details
Closed on
Apr 21, 2005
Sold by
Kornetzny Mary R
Bought by
Mary R Konetzny Lt
Create a Home Valuation Report for This Property
The Home Valuation Report is an in-depth analysis detailing your home's value as well as a comparison with similar homes in the area
Home Values in the Area
Average Home Value in this Area
Purchase History
| Date | Buyer | Sale Price | Title Company |
|---|---|---|---|
| Konetzny Int | $140,500 | None Available | |
| Konetzny Int | $140,500 | None Available | |
| Konetzny Int | -- | -- | |
| Konetzny Int | -- | -- | |
| Konetzny Int | -- | -- | |
| Konetzny Ft | -- | -- | |
| Konetzny Ft | -- | -- | |
| Pj Konetzny Nt | -- | -- | |
| Pj Konetzny Nt | -- | -- | |
| Konetzny Paul E | -- | -- | |
| Konetzny Paul E | -- | -- | |
| Mary R Konetzny Lt | -- | -- | |
| Konetzny Ft | -- | -- | |
| Pj Konetzny Nt | -- | -- | |
| Konetzny Paul E | -- | -- | |
| Mary R Konetzny Lt | -- | -- |
Source: Public Records
Tax History
| Year | Tax Paid | Tax Assessment Tax Assessment Total Assessment is a certain percentage of the fair market value that is determined by local assessors to be the total taxable value of land and additions on the property. | Land | Improvement |
|---|---|---|---|---|
| 2025 | $4,208 | $425,100 | $291,400 | $133,700 |
| 2024 | $4,217 | $405,900 | $277,500 | $128,400 |
| 2023 | $3,978 | $364,400 | $257,700 | $106,700 |
| 2022 | $3,978 | $307,200 | $208,100 | $99,100 |
| 2021 | $3,884 | $294,500 | $206,100 | $88,400 |
| 2020 | $3,618 | $271,400 | $188,300 | $83,100 |
| 2019 | $3,559 | $266,000 | $188,300 | $77,700 |
| 2018 | $3,556 | $266,000 | $188,300 | $77,700 |
| 2017 | $3,372 | $245,800 | $178,400 | $67,400 |
| 2016 | $3,274 | $235,900 | $168,500 | $67,400 |
| 2015 | $3,135 | $235,900 | $168,500 | $67,400 |
| 2014 | $2,911 | $219,000 | $154,600 | $64,400 |
Source: Public Records
Map
Nearby Homes
- 19 2nd Rd
- 122 June St
- 78 Tower Ave
- 38 Winthrop Dr
- 256 Ocean St
- 32 Gratto Rd
- 106 Careswell St
- 30 Chandler Dr
- 42 Carr Rd
- 116 Outlook Rd
- 86 Barouche Dr
- 92 Salt Meadow Waye
- 1801 Ocean St Unit B31
- 713 Webster St
- 255 Ridge Rd
- 71 Gurnet Rd
- 39 High Beacon Way
- 16 Schooner Way
- 566 Holly Rd
- 184 King Phillips Pathe