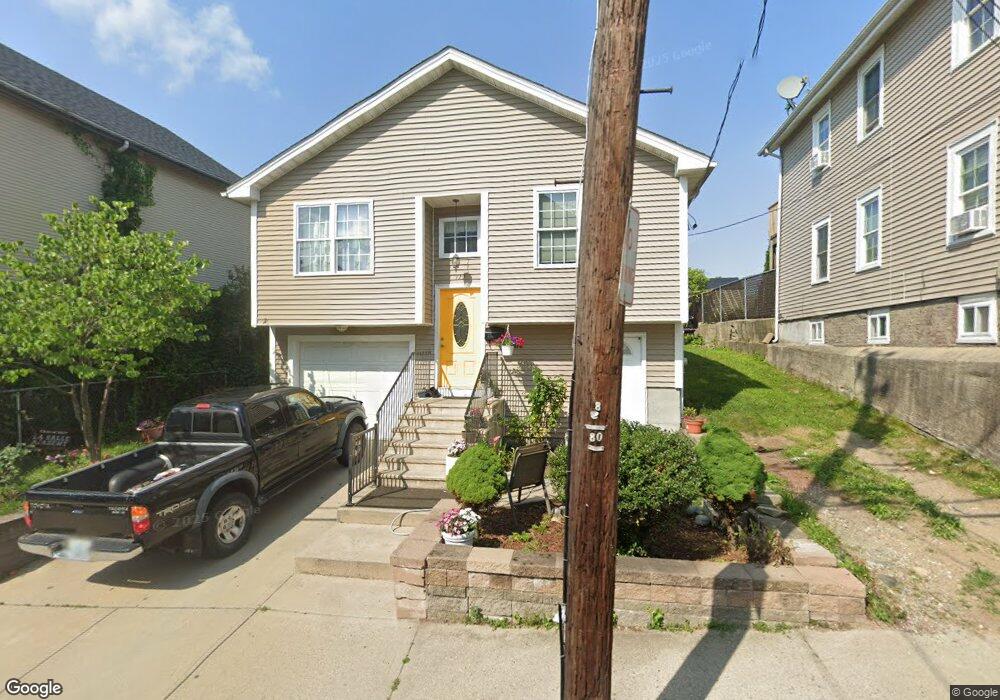
729 Pine St Central Falls, RI 02863
Estimated Value: $331,000 - $410,000
3
Beds
1
Bath
1,724
Sq Ft
$218/Sq Ft
Est. Value
About This Home
This home is located at 729 Pine St, Central Falls, RI 02863 and is currently estimated at $375,428, approximately $217 per square foot. 729 Pine St is a home located in Providence County with nearby schools including Central Falls Senior High School and Blackstone Valley Prep Junior High School.
Ownership History
Date
Name
Owned For
Owner Type
Purchase Details
Closed on
Jun 3, 2015
Sold by
V Almeida Remodeling I
Bought by
Arriaga Mario R
Current Estimated Value
Home Financials for this Owner
Home Financials are based on the most recent Mortgage that was taken out on this home.
Original Mortgage
$150,000
Outstanding Balance
$115,637
Interest Rate
3.62%
Mortgage Type
New Conventional
Estimated Equity
$259,791
Purchase Details
Closed on
Jan 10, 2007
Sold by
1 Way Investments
Bought by
Remodeling V Almeida
Create a Home Valuation Report for This Property
The Home Valuation Report is an in-depth analysis detailing your home's value as well as a comparison with similar homes in the area
Home Values in the Area
Average Home Value in this Area
Purchase History
| Date | Buyer | Sale Price | Title Company |
|---|---|---|---|
| Arriaga Mario R | $160,000 | -- | |
| Remodeling V Almeida | $51,000 | -- |
Source: Public Records
Mortgage History
| Date | Status | Borrower | Loan Amount |
|---|---|---|---|
| Open | Remodeling V Almeida | $150,000 |
Source: Public Records
Tax History
| Year | Tax Paid | Tax Assessment Tax Assessment Total Assessment is a certain percentage of the fair market value that is determined by local assessors to be the total taxable value of land and additions on the property. | Land | Improvement |
|---|---|---|---|---|
| 2025 | $4,374 | $331,100 | $100,800 | $230,300 |
| 2024 | $4,661 | $247,800 | $75,500 | $172,300 |
| 2023 | $4,597 | $247,800 | $75,500 | $172,300 |
| 2022 | $2,974 | $247,800 | $75,500 | $172,300 |
| 2021 | $4,001 | $168,400 | $26,100 | $142,300 |
| 2020 | $3,989 | $168,400 | $26,100 | $142,300 |
| 2019 | $4,170 | $168,400 | $26,100 | $142,300 |
| 2018 | $4,225 | $160,600 | $25,200 | $135,400 |
| 2017 | $4,225 | $160,600 | $25,200 | $135,400 |
| 2016 | $4,164 | $160,600 | $25,200 | $135,400 |
| 2015 | $3,655 | $132,300 | $23,800 | $108,500 |
| 2014 | -- | $132,300 | $23,800 | $108,500 |
| 2013 | $3,403 | $132,300 | $23,800 | $108,500 |
Source: Public Records
Map
Nearby Homes
- 722 Dexter St Unit 726
- 616 Lonsdale Ave Unit 618
- 129 Liberty St
- 2 Valley St
- 546 Lonsdale Ave Unit 548
- 66 Perry St
- 152 Washington St
- 162 Washington St
- 127 Chestnut St
- 76 Sylvian St Unit 80
- 234 Central St Unit 236
- 70 Lincoln Ave
- 150 Cottage St
- 27 Lloyd St
- 218 Central St
- 57 Sylvian St
- 122 Elder St
- 7 Fales St
- 30 Foundry St Unit 6
- 84 Barton St
Your Personal Tour Guide
Ask me questions while you tour the home.