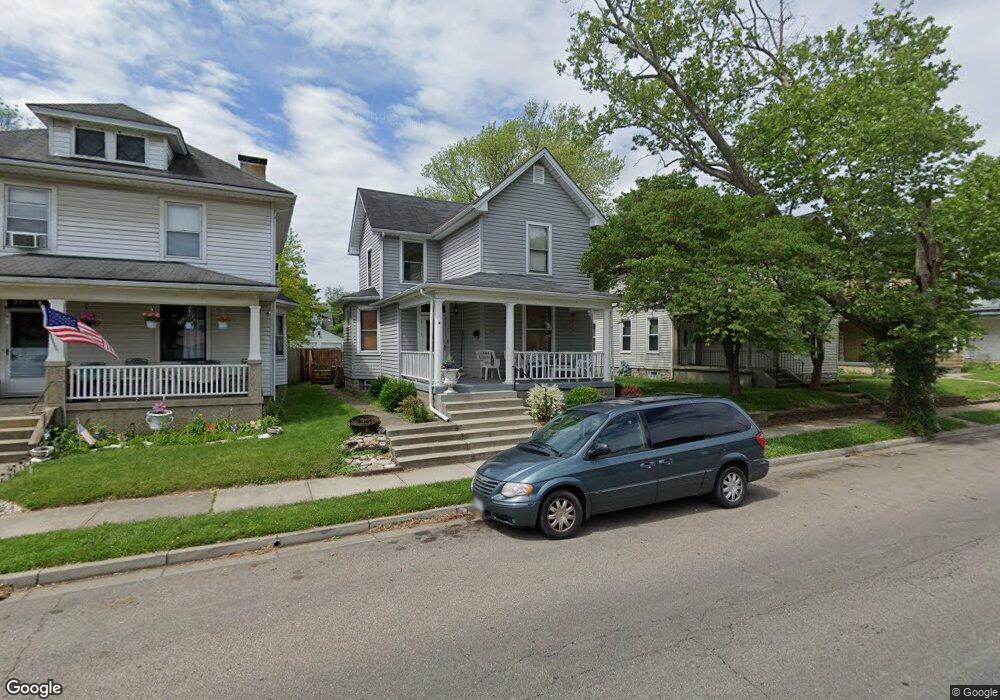
729 Ross Ave Hamilton, OH 45013
Estimated Value: $115,000 - $207,000
4
Beds
2
Baths
1,529
Sq Ft
$114/Sq Ft
Est. Value
About This Home
This home is located at 729 Ross Ave, Hamilton, OH 45013 and is currently estimated at $174,812, approximately $114 per square foot. 729 Ross Ave is a home located in Butler County with nearby schools including Highland Elementary School, Wilson Middle School, and Hamilton High School Main Campus.
Ownership History
Date
Name
Owned For
Owner Type
Purchase Details
Closed on
Oct 25, 2010
Sold by
Everbank
Bought by
Secretary Of Housing & Urban Development
Current Estimated Value
Purchase Details
Closed on
Sep 27, 2010
Sold by
Murphy Brian W and Tharp Bobetta
Bought by
Everbank
Purchase Details
Closed on
Feb 25, 2005
Sold by
Rivers Teresa and Mink Teresa Ruth
Bought by
Murphy Brian W and Tharp Bobetta
Home Financials for this Owner
Home Financials are based on the most recent Mortgage that was taken out on this home.
Original Mortgage
$95,501
Interest Rate
5.8%
Mortgage Type
FHA
Purchase Details
Closed on
Jan 1, 1985
Create a Home Valuation Report for This Property
The Home Valuation Report is an in-depth analysis detailing your home's value as well as a comparison with similar homes in the area
Home Values in the Area
Average Home Value in this Area
Purchase History
| Date | Buyer | Sale Price | Title Company |
|---|---|---|---|
| Secretary Of Housing & Urban Development | -- | None Available | |
| Everbank | $36,000 | Attorney | |
| Murphy Brian W | $97,000 | -- | |
| -- | $40,300 | -- |
Source: Public Records
Mortgage History
| Date | Status | Borrower | Loan Amount |
|---|---|---|---|
| Previous Owner | Murphy Brian W | $95,501 |
Source: Public Records
Tax History Compared to Growth
Tax History
| Year | Tax Paid | Tax Assessment Tax Assessment Total Assessment is a certain percentage of the fair market value that is determined by local assessors to be the total taxable value of land and additions on the property. | Land | Improvement |
|---|---|---|---|---|
| 2024 | $1,368 | $41,860 | $6,920 | $34,940 |
| 2023 | $1,375 | $41,860 | $6,920 | $34,940 |
| 2022 | $1,450 | $30,420 | $6,920 | $23,500 |
| 2021 | $939 | $29,430 | $6,920 | $22,510 |
| 2020 | $978 | $29,430 | $6,920 | $22,510 |
| 2019 | $1,990 | $27,180 | $6,890 | $20,290 |
| 2018 | $1,299 | $27,180 | $6,890 | $20,290 |
| 2017 | $1,277 | $27,180 | $6,890 | $20,290 |
| 2016 | $1,254 | $25,430 | $6,890 | $18,540 |
| 2015 | $1,247 | $25,430 | $6,890 | $18,540 |
| 2014 | $406 | $25,430 | $6,890 | $18,540 |
| 2013 | $406 | $9,100 | $6,890 | $2,210 |
Source: Public Records
Map
Nearby Homes