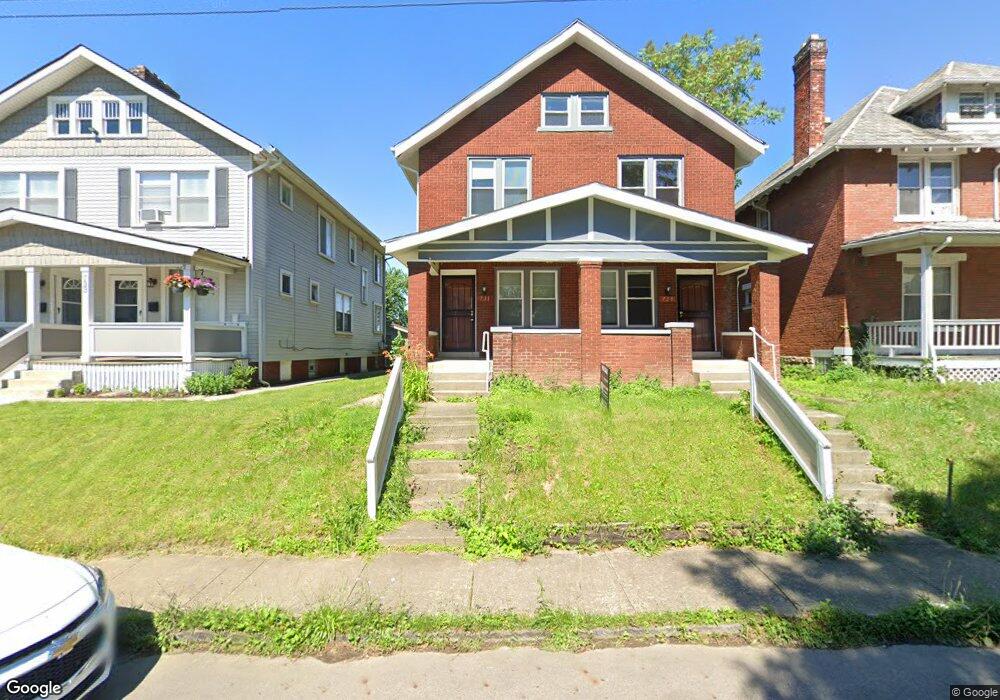
729 S 18th St Unit 731 Columbus, OH 43206
Southern Orchards NeighborhoodEstimated Value: $374,882 - $483,000
6
Beds
2
Baths
2,691
Sq Ft
$167/Sq Ft
Est. Value
About This Home
This home is located at 729 S 18th St Unit 731, Columbus, OH 43206 and is currently estimated at $448,721, approximately $166 per square foot. 729 S 18th St Unit 731 is a home located in Franklin County with nearby schools including Livingston Elementary School, South High School, and South Columbus Preparatory Academy.
Ownership History
Date
Name
Owned For
Owner Type
Purchase Details
Closed on
Sep 22, 2020
Sold by
Woldegebrial Gebregziabher and Tekeste Biniam G
Bought by
Fz Investment Llc
Current Estimated Value
Purchase Details
Closed on
Jul 16, 2015
Sold by
City Of Columbus
Bought by
Woldegebrial Gebregziabher
Purchase Details
Closed on
Jan 26, 2015
Sold by
Settachan Vasin and Leonard Edward
Bought by
City Of Columbus
Purchase Details
Closed on
Aug 15, 2005
Sold by
Fahys Properties Ltd and Fahys Virginia E
Bought by
Settachan Vasin
Home Financials for this Owner
Home Financials are based on the most recent Mortgage that was taken out on this home.
Original Mortgage
$57,450
Interest Rate
5.69%
Mortgage Type
Fannie Mae Freddie Mac
Purchase Details
Closed on
Jan 18, 1990
Bought by
Fahys Virginia E
Purchase Details
Closed on
Nov 1, 1983
Create a Home Valuation Report for This Property
The Home Valuation Report is an in-depth analysis detailing your home's value as well as a comparison with similar homes in the area
Home Values in the Area
Average Home Value in this Area
Purchase History
| Date | Buyer | Sale Price | Title Company |
|---|---|---|---|
| Fz Investment Llc | $320,000 | World Class Title | |
| Woldegebrial Gebregziabher | -- | Attorney | |
| City Of Columbus | -- | None Available | |
| Settachan Vasin | $82,500 | -- | |
| Fahys Virginia E | $20,500 | -- | |
| -- | $25,000 | -- |
Source: Public Records
Mortgage History
| Date | Status | Borrower | Loan Amount |
|---|---|---|---|
| Previous Owner | Settachan Vasin | $57,450 |
Source: Public Records
Tax History Compared to Growth
Tax History
| Year | Tax Paid | Tax Assessment Tax Assessment Total Assessment is a certain percentage of the fair market value that is determined by local assessors to be the total taxable value of land and additions on the property. | Land | Improvement |
|---|---|---|---|---|
| 2024 | $5,518 | $120,410 | $30,560 | $89,850 |
| 2023 | $5,449 | $120,400 | $30,555 | $89,845 |
| 2022 | $4,066 | $73,680 | $6,650 | $67,030 |
| 2021 | $4,118 | $73,680 | $6,650 | $67,030 |
| 2020 | $2,508 | $47,040 | $6,650 | $40,390 |
| 2019 | $2,443 | $36,260 | $5,110 | $31,150 |
| 2018 | $1,148 | $36,260 | $5,110 | $31,150 |
| 2017 | $1,674 | $26,920 | $5,110 | $21,810 |
| 2016 | $1,237 | $16,810 | $4,520 | $12,290 |
| 2015 | $21 | $16,810 | $4,520 | $12,290 |
| 2014 | $1,042 | $16,810 | $4,520 | $12,290 |
| 2013 | $614 | $17,675 | $4,760 | $12,915 |
Source: Public Records
Map
Nearby Homes
- 792 S 18th St
- 786 Ann St
- 1095 E Sycamore St
- 800 Carpenter St
- 863 Carpenter St
- 785 Gilbert St
- 667 E Columbus St
- 841 Ann St
- 901 Heyl Ave
- 903 E Livingston Ave
- 575 E Columbus St Unit 577
- 561 South Ln
- 867 S 22nd St
- 644 Stanley Ave
- 887-891 S 22nd St
- 669 S 22nd St
- 954 S 18th St
- 665 S 22nd St
- 958 S 18th St
- 517 Forest St
- 729 S 18th St Unit 31
- 729-731 S 18th St
- 733 S 18th St Unit 735
- 735 E Beck St
- 723 S 18th St
- 733-735 S 18th St
- 741 S 18th St
- 745-747 S 18th St
- 745 S 18th St Unit 747
- 711 S 18th St
- 740 S 18th St
- 720 S 17th St Unit 722
- 729 E Beck St
- 751 S 18th St
- 705 S 18th St Unit 707
- 746 S 18th St
- 732 S 18th St
- 748 S 18th St
- 749 S 18th St
- 732 S 17th St