729 S Main St Unit 1 Manville, NJ 08835
Estimated Value: $1,461,043
--
Bed
--
Bath
12,000
Sq Ft
$122/Sq Ft
Est. Value
About This Home
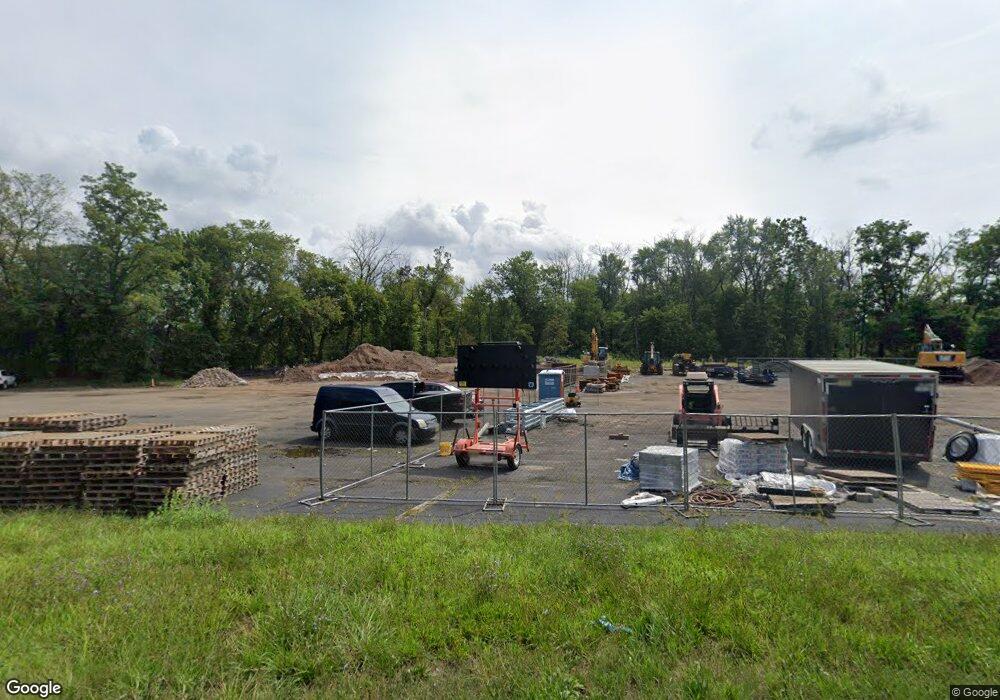
This home is located at 729 S Main St Unit 1, Manville, NJ 08835 and is currently priced at $1,461,043, approximately $121 per square foot. 729 S Main St Unit 1 is a home located in Somerset County with nearby schools including Weston Elementary School, Roosevelt School, and Alexander Batcho Intermediate School (ABIS).
Ownership History
Date
Name
Owned For
Owner Type
Purchase Details
Closed on
Jun 6, 2018
Sold by
Rytham Realty Limited Liability Company
Bought by
Kohinoor Usa Llc
Current Estimated Value
Home Financials for this Owner
Home Financials are based on the most recent Mortgage that was taken out on this home.
Original Mortgage
$55,000
Outstanding Balance
$47,566
Interest Rate
4.5%
Mortgage Type
Purchase Money Mortgage
Purchase Details
Closed on
Jul 8, 2015
Sold by
John Pettoni Jr Llc
Bought by
Rytham Realty L L C
Purchase Details
Closed on
May 3, 2005
Sold by
Borough Of Manville
Bought by
John Pettoni Jr Llc
Create a Home Valuation Report for This Property
The Home Valuation Report is an in-depth analysis detailing your home's value as well as a comparison with similar homes in the area
Home Values in the Area
Average Home Value in this Area
Purchase History
| Date | Buyer | Sale Price | Title Company |
|---|---|---|---|
| Kohinoor Usa Llc | $1,100,000 | Multiple | |
| Rytham Realty L L C | $750,000 | Agent For Westcor Land Title | |
| John Pettoni Jr Llc | $20,000 | None Available |
Source: Public Records
Mortgage History
| Date | Status | Borrower | Loan Amount |
|---|---|---|---|
| Open | Kohinoor Usa Llc | $55,000 |
Source: Public Records
Tax History Compared to Growth
Tax History
| Year | Tax Paid | Tax Assessment Tax Assessment Total Assessment is a certain percentage of the fair market value that is determined by local assessors to be the total taxable value of land and additions on the property. | Land | Improvement |
|---|---|---|---|---|
| 2025 | $4,389 | $210,000 | $205,000 | $5,000 |
| 2024 | $4,389 | $195,000 | $190,000 | $5,000 |
| 2023 | $4,447 | $185,000 | $180,000 | $5,000 |
| 2022 | $4,840 | $185,000 | $180,000 | $5,000 |
| 2021 | $28,083 | $949,700 | $324,000 | $625,700 |
| 2020 | $29,906 | $949,700 | $324,000 | $625,700 |
| 2019 | $27,760 | $849,700 | $324,000 | $525,700 |
| 2018 | $24,515 | $749,700 | $324,000 | $425,700 |
| 2017 | $24,095 | $749,700 | $324,000 | $425,700 |
| 2016 | $23,226 | $749,700 | $324,000 | $425,700 |
| 2015 | $26,587 | $1,100,000 | $392,600 | $707,400 |
| 2014 | $26,059 | $1,100,000 | $392,600 | $707,400 |
Source: Public Records
Map
Nearby Homes