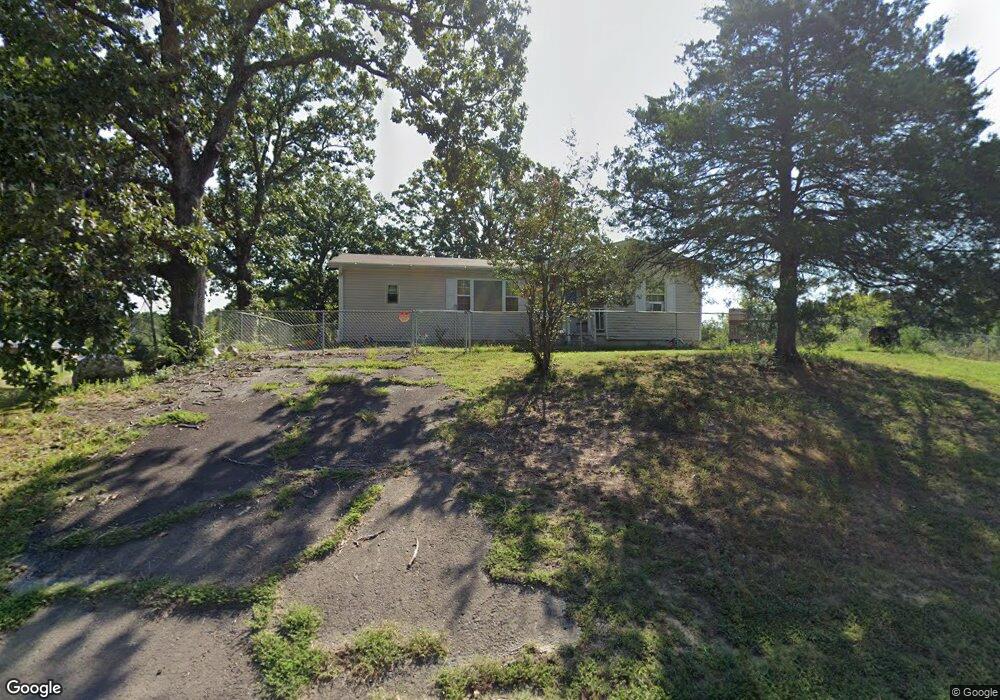
729 S Moore Rd Hot Springs National Park, AR 71913
Estimated Value: $213,742 - $251,000
2
Beds
2
Baths
1,734
Sq Ft
$133/Sq Ft
Est. Value
About This Home
This home is located at 729 S Moore Rd, Hot Springs National Park, AR 71913 and is currently estimated at $230,186, approximately $132 per square foot. 729 S Moore Rd is a home located in Garland County with nearby schools including Lake Hamilton Primary School, Lake Hamilton Elementary School, and Lake Hamilton Interm. School.
Ownership History
Date
Name
Owned For
Owner Type
Purchase Details
Closed on
Aug 19, 2015
Bought by
Homan Terry W
Current Estimated Value
Purchase Details
Closed on
Mar 28, 2008
Sold by
Hudak Edward Patrick and Hudak Lisa Marie Mikeo
Bought by
Montalvo Deborah and Montalvo William
Home Financials for this Owner
Home Financials are based on the most recent Mortgage that was taken out on this home.
Original Mortgage
$128,750
Interest Rate
6.19%
Mortgage Type
New Conventional
Purchase Details
Closed on
May 14, 2007
Sold by
Gilmore Linda E
Bought by
Hudak Edward Patrick and Hudak Lisa Marie Mikeo
Home Financials for this Owner
Home Financials are based on the most recent Mortgage that was taken out on this home.
Original Mortgage
$120,000
Interest Rate
6.16%
Mortgage Type
New Conventional
Purchase Details
Closed on
Sep 21, 1990
Sold by
Not Provided
Bought by
Gilmore Larry W and Gilmore Linda E
Create a Home Valuation Report for This Property
The Home Valuation Report is an in-depth analysis detailing your home's value as well as a comparison with similar homes in the area
Home Values in the Area
Average Home Value in this Area
Purchase History
| Date | Buyer | Sale Price | Title Company |
|---|---|---|---|
| Homan Terry W | $121,000 | -- | |
| Montalvo Deborah | $144,000 | Garland County Title Company | |
| Hudak Edward Patrick | $120,000 | Garland County Title Company | |
| Gilmore Larry W | $32,000 | -- |
Source: Public Records
Mortgage History
| Date | Status | Borrower | Loan Amount |
|---|---|---|---|
| Previous Owner | Montalvo Deborah | $128,750 | |
| Previous Owner | Hudak Edward Patrick | $120,000 |
Source: Public Records
Tax History Compared to Growth
Tax History
| Year | Tax Paid | Tax Assessment Tax Assessment Total Assessment is a certain percentage of the fair market value that is determined by local assessors to be the total taxable value of land and additions on the property. | Land | Improvement |
|---|---|---|---|---|
| 2025 | $503 | $32,750 | $5,400 | $27,350 |
| 2024 | $543 | $32,750 | $5,400 | $27,350 |
| 2023 | $572 | $32,750 | $5,400 | $27,350 |
| 2022 | $1,027 | $32,750 | $5,400 | $27,350 |
| 2021 | $975 | $20,700 | $3,600 | $17,100 |
| 2020 | $600 | $20,700 | $3,600 | $17,100 |
| 2019 | $540 | $20,700 | $3,600 | $17,100 |
| 2018 | $548 | $20,700 | $3,600 | $17,100 |
| 2017 | $507 | $20,700 | $3,600 | $17,100 |
| 2016 | $466 | $18,470 | $3,600 | $14,870 |
| 2015 | $851 | $19,260 | $4,390 | $14,870 |
| 2014 | $851 | $19,260 | $4,390 | $14,870 |
Source: Public Records
Map
Nearby Homes
- 130 Kidder Ln
- 127 Carnation Place
- 108 Teresa Ln
- 103 Deer View Ct
- 218 Charming Heights Dr
- 209 Fortress Ln
- 209 Fox Chase Cir
- 237 Fox Chase Cir
- TBD Airport Hwy
- 1209 S Moore Rd
- 2467 Airport Rd
- 509 Walnut Hill Dr
- 214 S Ross Maddox Rd
- 107 Hilton St
- 101 Sundance Trail
- 121 Sundance Trail
- 111 Rolling Acres Dr
- 734 Randall Rd
- 104 Kidder Ln
- 105 Carnation Place
- 111 Kidder Ln
- 730 S Moore Rd
- 670 S Moore Rd
- 100 Westhill Ln
- 766 S Moore Rd
- 102 Westhill Ln
- 131 Kidder Ln
- 113 Carnation Place
- 000 Kidder Ln
- 104 Westhill Ln
- 106 Westhill Ln
- 108 Ranchester Terrace
- 104 Ranchester Terrace
- 779 S Moore Rd
- 239 Lakade Cir
- 237 Lakade Cir
- 108 Westhill Ln
- 233 Lakade Cir