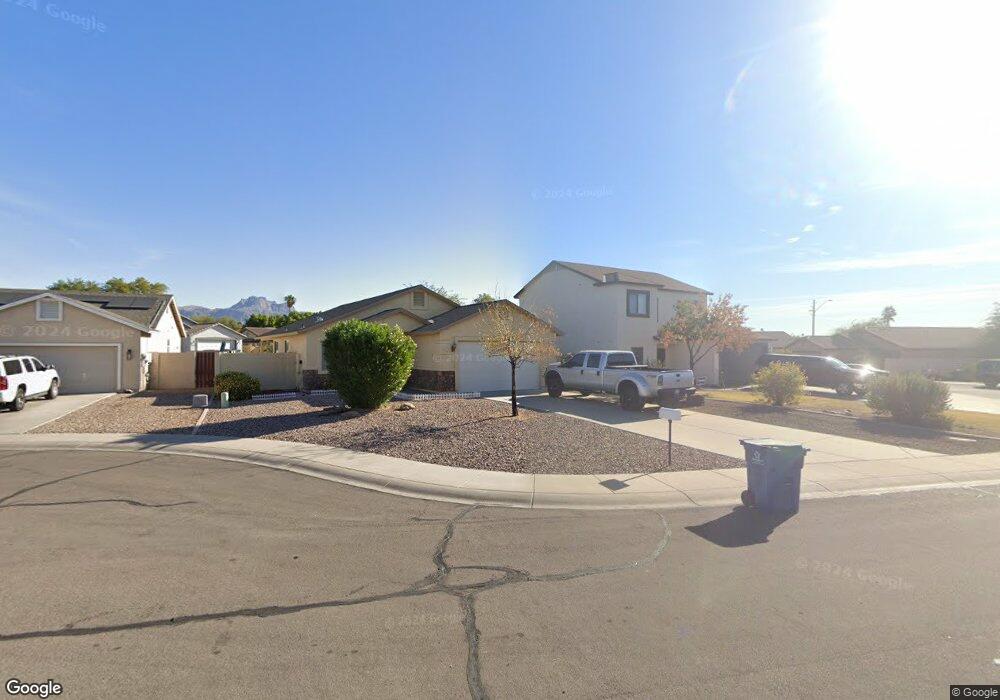
729 S Paustian Cir Apache Junction, AZ 85120
Estimated Value: $323,000 - $411,000
3
Beds
2
Baths
1,541
Sq Ft
$245/Sq Ft
Est. Value
About This Home
This home is located at 729 S Paustian Cir, Apache Junction, AZ 85120 and is currently estimated at $376,818, approximately $244 per square foot. 729 S Paustian Cir is a home located in Pinal County with nearby schools including Desert Vista Elementary School, Cactus Canyon Junior High School, and Apache Junction High School.
Ownership History
Date
Name
Owned For
Owner Type
Purchase Details
Closed on
May 27, 2009
Sold by
Wells Fargo Financial Arizona Inc
Bought by
Holland Pat and Hollan Jack R
Current Estimated Value
Home Financials for this Owner
Home Financials are based on the most recent Mortgage that was taken out on this home.
Original Mortgage
$70,400
Outstanding Balance
$44,528
Interest Rate
4.79%
Mortgage Type
New Conventional
Estimated Equity
$332,290
Purchase Details
Closed on
Feb 16, 2009
Sold by
Ray Nielson E and Ray Vanessa D
Bought by
Wells Fargo Financial Arizona Inc
Purchase Details
Closed on
Apr 17, 2007
Sold by
Ray Gordon E and Ray Christee A
Bought by
Ray Nielson E and Ray Vanessa D
Purchase Details
Closed on
Jun 13, 2005
Sold by
Sun Scape Development Inc
Bought by
Ray G Scott and Ray Gina L
Create a Home Valuation Report for This Property
The Home Valuation Report is an in-depth analysis detailing your home's value as well as a comparison with similar homes in the area
Home Values in the Area
Average Home Value in this Area
Purchase History
| Date | Buyer | Sale Price | Title Company |
|---|---|---|---|
| Holland Pat | $88,000 | First American Title Ins Co | |
| Wells Fargo Financial Arizona Inc | $100,000 | None Available | |
| Ray Nielson E | $175,800 | None Available | |
| Ray G Scott | $90,000 | Capital Title Agency Inc |
Source: Public Records
Mortgage History
| Date | Status | Borrower | Loan Amount |
|---|---|---|---|
| Open | Holland Pat | $70,400 |
Source: Public Records
Tax History
| Year | Tax Paid | Tax Assessment Tax Assessment Total Assessment is a certain percentage of the fair market value that is determined by local assessors to be the total taxable value of land and additions on the property. | Land | Improvement |
|---|---|---|---|---|
| 2025 | $1,490 | $34,101 | -- | -- |
| 2024 | $1,444 | $36,059 | -- | -- |
| 2023 | $1,469 | $28,581 | $0 | $0 |
| 2022 | $1,405 | $22,302 | $4,760 | $17,542 |
| 2021 | $1,444 | $20,266 | $0 | $0 |
| 2020 | $1,409 | $19,663 | $0 | $0 |
| 2019 | $1,425 | $18,820 | $0 | $0 |
| 2018 | $1,393 | $13,768 | $0 | $0 |
| 2017 | $1,398 | $12,943 | $0 | $0 |
| 2016 | $1,392 | $12,866 | $1,100 | $11,766 |
Source: Public Records
Map
Nearby Homes
- 861 W 5th Ave
- 880 S Buena Vista Dr
- 720 S Del Rio Ct
- 894 S Buena Vista Dr
- 831 S Phelps Dr
- 854 S San Marcos Dr Unit 7C
- 1059 W 5th Ave
- 924 W 10th Ave
- 1206 W Klamath Ave
- 2090 S Cherokee Ave
- 867 S Del Rio Ct
- 2205 W Klamath Ave Unit 205
- 1198 W Klamath Ave Unit 198
- 2082 W Klamath Ave
- 1537 S Omaha Dr Unit 537
- 1541 W Yurok Ave
- 337 S Thunderbird Dr
- 1540 W Yurok Ave Unit 540
- 1183 W Rosal Ave
- 2066 W Klamath Ave Unit 66
- 743 S Paustian Cir
- 719 S Paustian Cir
- 711 S Paustian Cir
- 674 W Sierra Vista Dr
- 732 S Paustian Cir
- 754 S Paustian Cir
- 724 S Paustian Cir Unit 4
- 708 S Paustian Cir
- 762 S Paustian Cir
- 740 S Paustian Cir
- 770 S Paustian Cir
- 746 S Paustian Cir
- 652 W Sierra Vista Dr
- 716 S Paustian Cir
- 717 W Datil Ave
- 717 W Datil Cir Unit 2
- 735 W Datil Cir
- 669 W Datil Ave
- 636 W Sierra Vista Dr
- 767 W Datil Cir
Your Personal Tour Guide
Ask me questions while you tour the home.