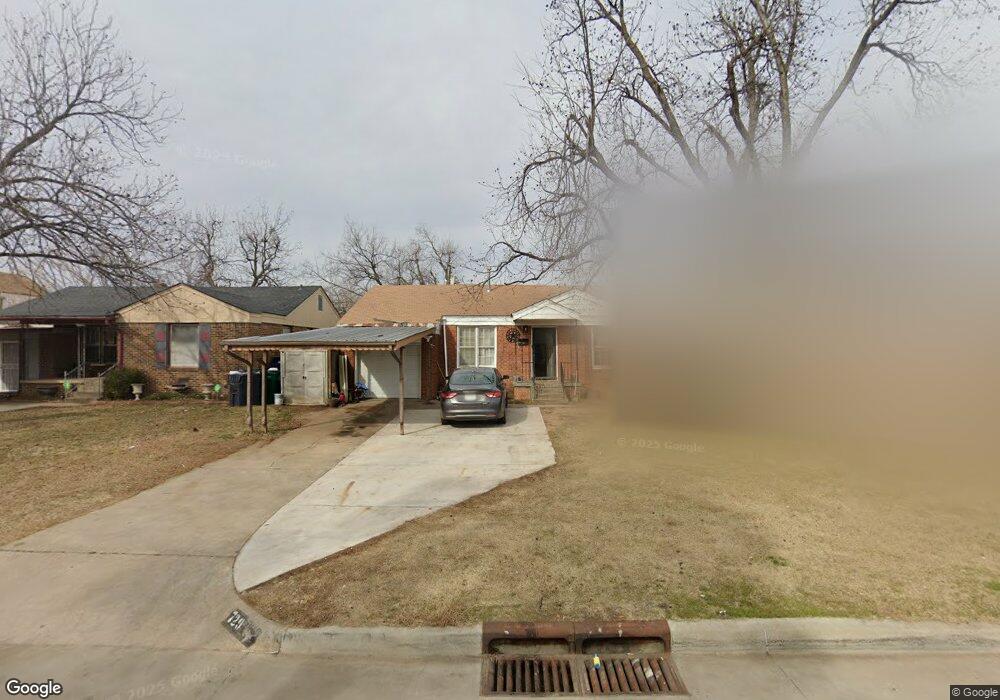
729 SW 47th St Oklahoma City, OK 73109
South Walker NeighborhoodEstimated Value: $101,000 - $155,000
3
Beds
1
Bath
1,348
Sq Ft
$97/Sq Ft
Est. Value
About This Home
This home is located at 729 SW 47th St, Oklahoma City, OK 73109 and is currently estimated at $130,422, approximately $96 per square foot. 729 SW 47th St is a home located in Oklahoma County with nearby schools including Fillmore Elementary School, Webster Middle School, and Capitol Hill High School.
Ownership History
Date
Name
Owned For
Owner Type
Purchase Details
Closed on
Sep 20, 2018
Sold by
Kuhlman Gerald and Sexton Trisha
Bought by
729Sw47 Llc
Current Estimated Value
Purchase Details
Closed on
May 2, 2018
Sold by
Harms Investments Llc
Bought by
Kuhlman Gerald and Sexton Trisha
Home Financials for this Owner
Home Financials are based on the most recent Mortgage that was taken out on this home.
Original Mortgage
$52,500
Interest Rate
4.45%
Mortgage Type
New Conventional
Purchase Details
Closed on
May 4, 2011
Sold by
Tindall Doris B and Alexander Mary L
Bought by
Harms Investment Llc
Purchase Details
Closed on
Aug 29, 2007
Sold by
Tindall Doris B and Tindall Doris Perry
Bought by
Tindall Doris B and Alexander Mary L
Purchase Details
Closed on
May 24, 2000
Sold by
Dodd Ollen F and Dodd Loy Jo
Bought by
Tindall Doris B and Alexander William J
Create a Home Valuation Report for This Property
The Home Valuation Report is an in-depth analysis detailing your home's value as well as a comparison with similar homes in the area
Home Values in the Area
Average Home Value in this Area
Purchase History
| Date | Buyer | Sale Price | Title Company |
|---|---|---|---|
| 729Sw47 Llc | -- | None Available | |
| Kuhlman Gerald | $70,000 | First American Title | |
| Harms Investment Llc | $45,000 | Old Republic Title Company O | |
| Tindall Doris B | -- | None Available | |
| Tindall Doris B | $47,500 | Stewart Abstract & Title |
Source: Public Records
Mortgage History
| Date | Status | Borrower | Loan Amount |
|---|---|---|---|
| Previous Owner | Kuhlman Gerald | $52,500 |
Source: Public Records
Tax History Compared to Growth
Tax History
| Year | Tax Paid | Tax Assessment Tax Assessment Total Assessment is a certain percentage of the fair market value that is determined by local assessors to be the total taxable value of land and additions on the property. | Land | Improvement |
|---|---|---|---|---|
| 2024 | $922 | $8,182 | $1,661 | $6,521 |
| 2023 | $922 | $7,793 | $1,811 | $5,982 |
| 2022 | $831 | $7,370 | $1,341 | $6,029 |
| 2021 | $828 | $7,370 | $1,341 | $6,029 |
| 2020 | $835 | $7,370 | $1,341 | $6,029 |
| 2019 | $832 | $7,370 | $1,341 | $6,029 |
| 2018 | $704 | $6,215 | $0 | $0 |
| 2017 | $697 | $6,159 | $1,171 | $4,988 |
| 2016 | $685 | $6,049 | $1,171 | $4,878 |
| 2015 | $694 | $6,075 | $1,171 | $4,904 |
| 2014 | $669 | $5,884 | $1,320 | $4,564 |
Source: Public Records
Map
Nearby Homes
- 623 SW 48th St
- 620 SW 48th St
- 629 SW 46th St
- 644 SW 44th St
- 624 SW 44th St
- 4406 S Olie Ave
- 628 SW 43rd St
- 516 SW 46th St
- 537 SW 45th St
- 4312 S Lee Ave
- 8 SW 41st St
- 325 SW 40th St
- 1104 SW 48th St
- 400 SW 42nd St
- 1112 SW 45th St
- 1125 SW 47th St
- 1004 SW 53rd St
- 227 SW 45th St
- 813 SW 56th St
- 816 SW 56th St