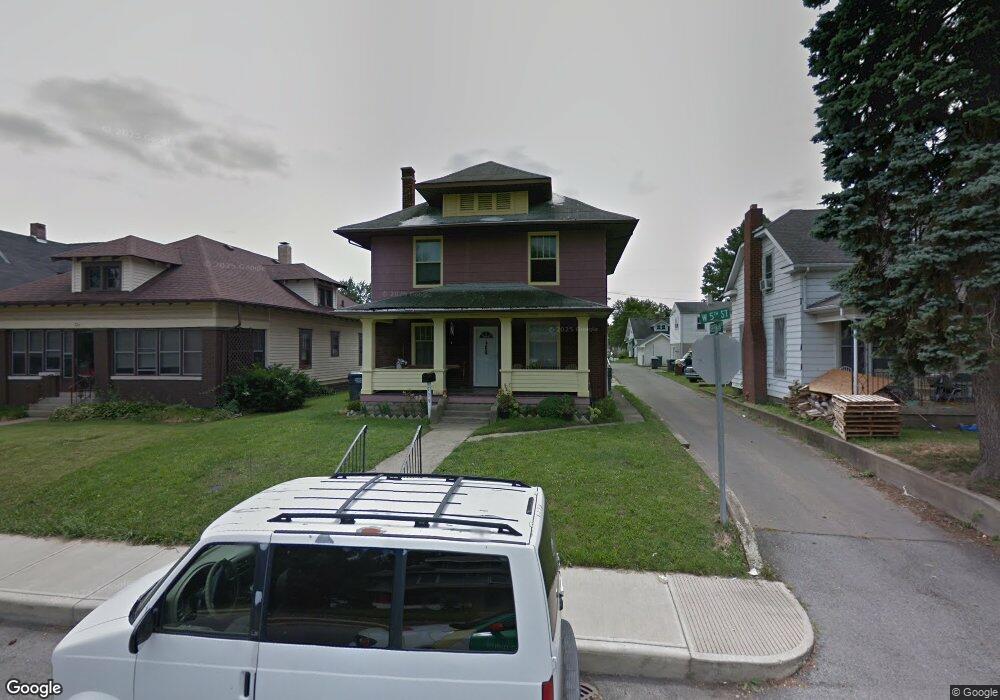
729 W 5th St Anderson, IN 46016
Estimated Value: $84,000 - $124,613
3
Beds
2
Baths
2,017
Sq Ft
$52/Sq Ft
Est. Value
About This Home
This home is located at 729 W 5th St, Anderson, IN 46016 and is currently estimated at $103,903, approximately $51 per square foot. 729 W 5th St is a home located in Madison County with nearby schools including Eastside Elementary School, Highland Middle School, and Anderson High School.
Ownership History
Date
Name
Owned For
Owner Type
Purchase Details
Closed on
Apr 20, 2011
Sold by
Deutsche Bank National Trust Co
Bought by
Rodriguez Fabian
Current Estimated Value
Purchase Details
Closed on
Dec 10, 2010
Sold by
Sundberg Robert
Bought by
Deutsche Bank National Trust Co
Purchase Details
Closed on
Mar 1, 2006
Sold by
Jackson Alphonso and Secretary Of Hud
Bought by
Sundberg Robert
Purchase Details
Closed on
Jul 29, 2005
Sold by
Crouch Connie Sue
Bought by
Department Of Hud
Purchase Details
Closed on
Dec 13, 2004
Sold by
Abn Mortgage Group Inc
Bought by
Department Of Hud
Create a Home Valuation Report for This Property
The Home Valuation Report is an in-depth analysis detailing your home's value as well as a comparison with similar homes in the area
Home Values in the Area
Average Home Value in this Area
Purchase History
| Date | Buyer | Sale Price | Title Company |
|---|---|---|---|
| Rodriguez Fabian | -- | -- | |
| Deutsche Bank National Trust Co | $16,000 | -- | |
| Sundberg Robert | -- | -- | |
| Department Of Hud | -- | -- | |
| Department Of Hud | -- | -- |
Source: Public Records
Tax History Compared to Growth
Tax History
| Year | Tax Paid | Tax Assessment Tax Assessment Total Assessment is a certain percentage of the fair market value that is determined by local assessors to be the total taxable value of land and additions on the property. | Land | Improvement |
|---|---|---|---|---|
| 2024 | $684 | $64,800 | $6,600 | $58,200 |
| 2023 | $674 | $58,900 | $6,300 | $52,600 |
| 2022 | $616 | $59,100 | $5,900 | $53,200 |
| 2021 | $573 | $54,200 | $5,900 | $48,300 |
| 2020 | $542 | $51,600 | $5,600 | $46,000 |
| 2019 | $524 | $50,200 | $5,600 | $44,600 |
| 2018 | $503 | $46,000 | $5,600 | $40,400 |
| 2017 | $449 | $45,500 | $5,600 | $39,900 |
| 2016 | $442 | $45,500 | $5,600 | $39,900 |
| 2014 | $492 | $50,400 | $6,300 | $44,100 |
| 2013 | $492 | $50,400 | $6,300 | $44,100 |
Source: Public Records
Map
Nearby Homes