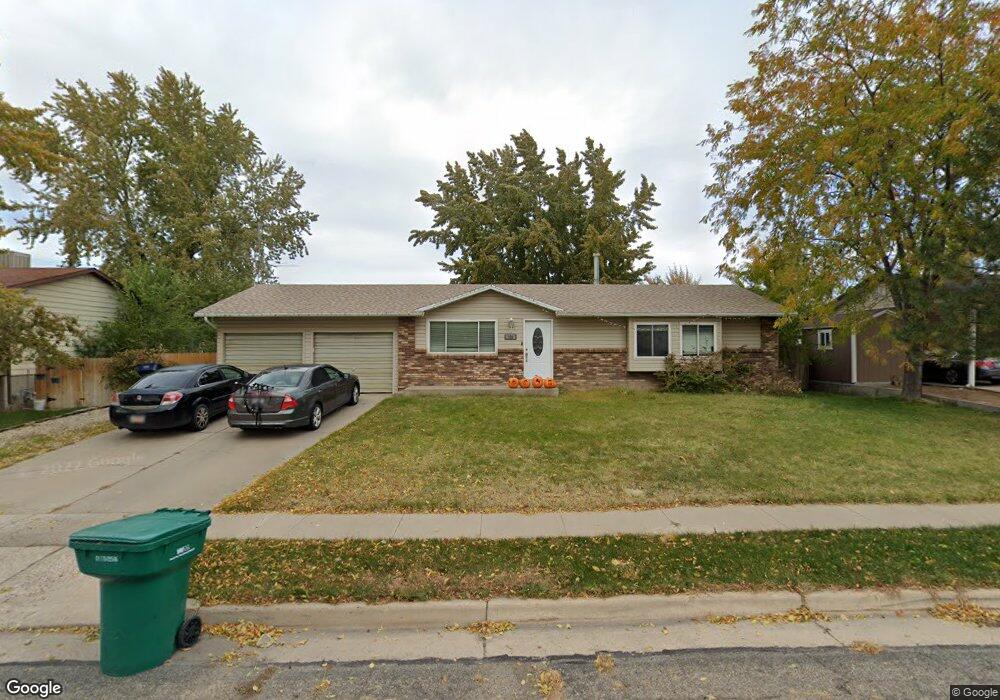
729 W 700 N Clearfield, UT 84015
Estimated Value: $421,000 - $435,000
5
Beds
2
Baths
2,084
Sq Ft
$206/Sq Ft
Est. Value
About This Home
This home is located at 729 W 700 N, Clearfield, UT 84015 and is currently estimated at $428,764, approximately $205 per square foot. 729 W 700 N is a home located in Davis County with nearby schools including Doxey School, North Davis Junior High School, and Clearfield High School.
Ownership History
Date
Name
Owned For
Owner Type
Purchase Details
Closed on
Jun 29, 2017
Sold by
Peterson Scott Martin and Peterson Jennifer Lynn
Bought by
Weight Camden and Weight Megan
Current Estimated Value
Home Financials for this Owner
Home Financials are based on the most recent Mortgage that was taken out on this home.
Original Mortgage
$234,945
Outstanding Balance
$194,996
Interest Rate
3.94%
Mortgage Type
VA
Estimated Equity
$233,768
Purchase Details
Closed on
Aug 29, 2007
Sold by
Strickler Charles A and Strickler Teresa A
Bought by
Peterson Scott Martin and Peterson Jennifer Lynn
Home Financials for this Owner
Home Financials are based on the most recent Mortgage that was taken out on this home.
Original Mortgage
$150,554
Interest Rate
6.74%
Mortgage Type
FHA
Create a Home Valuation Report for This Property
The Home Valuation Report is an in-depth analysis detailing your home's value as well as a comparison with similar homes in the area
Home Values in the Area
Average Home Value in this Area
Purchase History
| Date | Buyer | Sale Price | Title Company |
|---|---|---|---|
| Weight Camden | -- | Backman Title | |
| Peterson Scott Martin | -- | Equity Title Ins Agency Inc |
Source: Public Records
Mortgage History
| Date | Status | Borrower | Loan Amount |
|---|---|---|---|
| Open | Weight Camden | $234,945 | |
| Previous Owner | Peterson Scott Martin | $150,554 |
Source: Public Records
Tax History Compared to Growth
Tax History
| Year | Tax Paid | Tax Assessment Tax Assessment Total Assessment is a certain percentage of the fair market value that is determined by local assessors to be the total taxable value of land and additions on the property. | Land | Improvement |
|---|---|---|---|---|
| 2025 | $2,651 | $237,600 | $72,093 | $165,507 |
| 2024 | $2,553 | $230,450 | $68,925 | $161,525 |
| 2023 | $2,372 | $393,000 | $110,323 | $282,677 |
| 2022 | $2,572 | $230,450 | $63,209 | $167,241 |
| 2021 | $2,260 | $306,000 | $67,057 | $238,943 |
| 2020 | $1,963 | $264,000 | $56,367 | $207,633 |
| 2019 | $1,853 | $246,000 | $59,172 | $186,828 |
| 2018 | $1,663 | $215,000 | $52,521 | $162,479 |
| 2016 | $1,335 | $90,255 | $20,970 | $69,285 |
| 2015 | $1,287 | $82,940 | $20,970 | $61,970 |
| 2014 | $1,228 | $80,219 | $20,970 | $59,249 |
| 2013 | -- | $66,256 | $26,730 | $39,526 |
Source: Public Records
Map
Nearby Homes