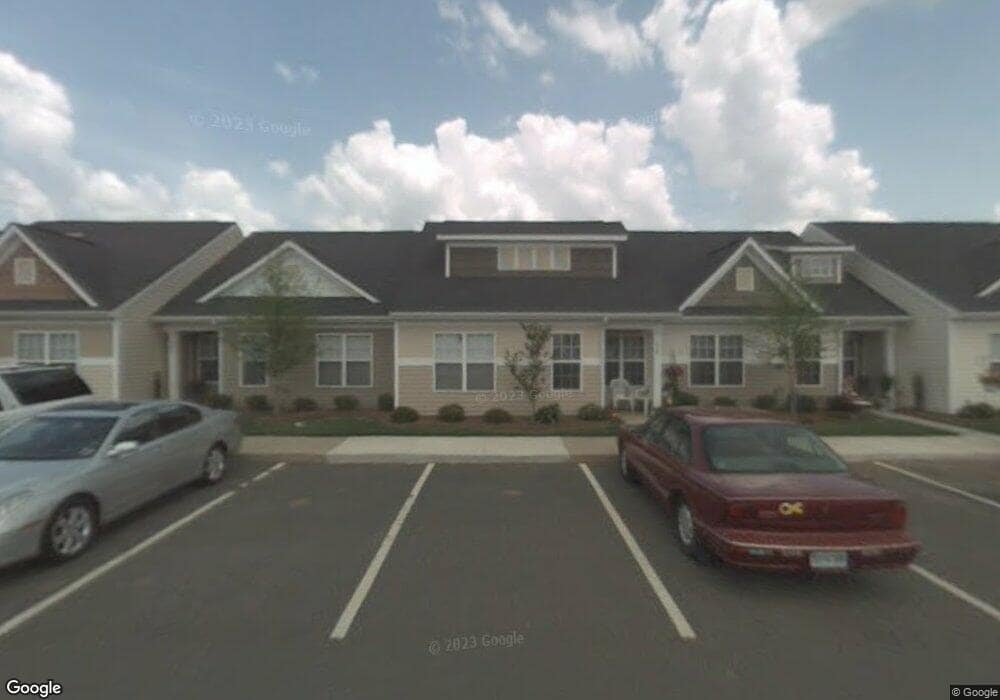
729 Waterfall Way Unit 126 Clover, SC 29710
Estimated Value: $249,000 - $268,693
3
Beds
2
Baths
1,118
Sq Ft
$233/Sq Ft
Est. Value
About This Home
This home is located at 729 Waterfall Way Unit 126, Clover, SC 29710 and is currently estimated at $260,673, approximately $233 per square foot. 729 Waterfall Way Unit 126 is a home located in York County with nearby schools including Crowders Creek Elementary School, Oakridge Middle School, and Clover High School.
Ownership History
Date
Name
Owned For
Owner Type
Purchase Details
Closed on
Jun 25, 2020
Sold by
Charles Richard S and Charles Patricia K
Bought by
Tavel Sean Matthew
Current Estimated Value
Purchase Details
Closed on
Feb 11, 2016
Sold by
Lawton La Nelle D
Bought by
Charles Richard S and Charles Patricia K
Purchase Details
Closed on
Feb 8, 2007
Sold by
Harpers Mill Community Developers Llc
Bought by
Lawton La Nelle D
Home Financials for this Owner
Home Financials are based on the most recent Mortgage that was taken out on this home.
Original Mortgage
$90,400
Interest Rate
6.17%
Mortgage Type
New Conventional
Create a Home Valuation Report for This Property
The Home Valuation Report is an in-depth analysis detailing your home's value as well as a comparison with similar homes in the area
Home Values in the Area
Average Home Value in this Area
Purchase History
| Date | Buyer | Sale Price | Title Company |
|---|---|---|---|
| Tavel Sean Matthew | $171,000 | None Available | |
| Charles Richard S | $112,000 | -- | |
| Lawton La Nelle D | $113,000 | None Available |
Source: Public Records
Mortgage History
| Date | Status | Borrower | Loan Amount |
|---|---|---|---|
| Previous Owner | Lawton La Nelle D | $90,400 |
Source: Public Records
Tax History Compared to Growth
Tax History
| Year | Tax Paid | Tax Assessment Tax Assessment Total Assessment is a certain percentage of the fair market value that is determined by local assessors to be the total taxable value of land and additions on the property. | Land | Improvement |
|---|---|---|---|---|
| 2025 | $1,047 | $7,650 | $1,760 | $5,890 |
| 2024 | $940 | $6,652 | $1,360 | $5,292 |
| 2023 | $961 | $6,631 | $1,360 | $5,271 |
| 2022 | $792 | $6,631 | $1,360 | $5,271 |
| 2021 | -- | $9,947 | $2,040 | $7,907 |
| 2020 | $531 | $4,692 | $0 | $0 |
| 2019 | $257 | $4,080 | $0 | $0 |
| 2018 | $506 | $4,080 | $0 | $0 |
| 2017 | $472 | $4,080 | $0 | $0 |
| 2016 | $1,612 | $4,980 | $0 | $0 |
| 2014 | $223 | $3,320 | $800 | $2,520 |
| 2013 | $223 | $3,960 | $800 | $3,160 |
Source: Public Records
Map
Nearby Homes
- 743 Waterfall Way
- 2095 Shady Pond Dr
- 2099 Shady Pond Dr
- 1437 Harpers Inlet Dr
- 2180 Shady Pond Dr
- 1032 Valley Forge Dr
- 1026 Valley Forge Dr
- 126 Misty Woods Dr
- 121 Misty Woods Dr
- 2323 Branch Hill Ln
- 1411 Swaying Branch Ln
- 341 Windy Pine Dr
- 5426 Riverfront Rd
- 1921 Notchwood Ct
- 447 Leaf Arbor Ct
- 335 Carroll Cove
- 1727 Mineral Springs Rd
- 481 Evergreen Rd
- 46 Timberidge Dr
- 0000 Senator Rd
- 729 Waterfall Way
- 731 Waterfall Way
- 727 Waterfall Way
- 725 Waterfall Way
- 733 Waterfall Way
- 733 Waterfall Way
- 723 Waterfall Way
- 737 Waterfall Way
- 739 Waterfall Way
- 739 Waterfall Way Unit 122
- 730 Waterfall Way
- 719 Waterfall Way
- 719 Waterfall Way Unit 130
- 726 Waterfall Way
- 732 Waterfall Way
- 724 Waterfall Way
- 741 Waterfall Way
- 734 Waterfall Way
- 722 Waterfall Way
- 607 Old Mill Rd Unit 82