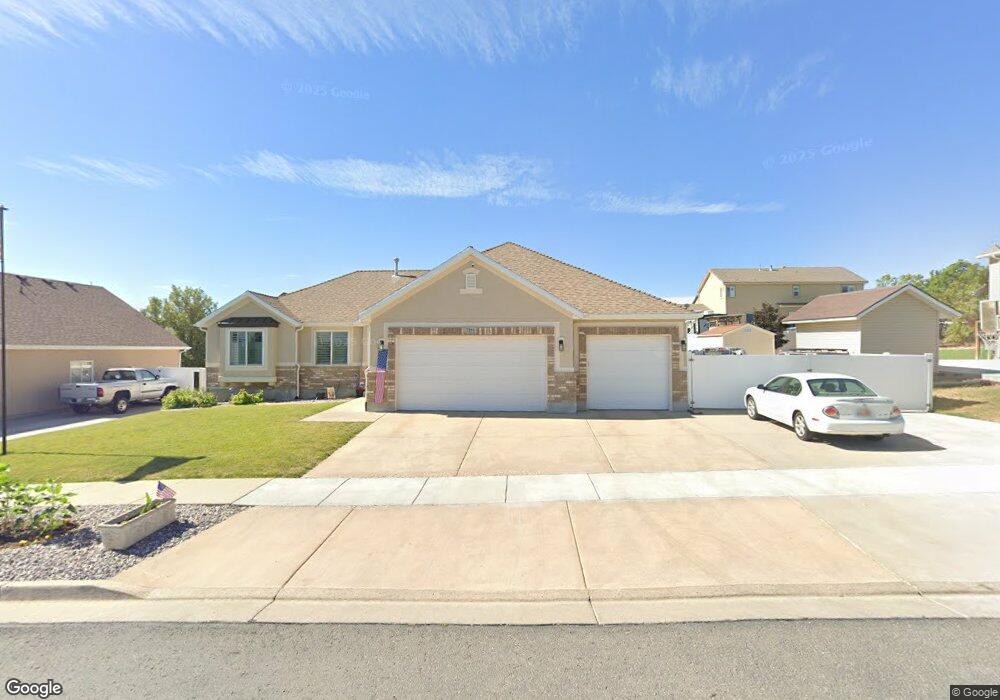
7291 Sycamore Farm Rd West Jordan, UT 84081
Jordan Hills NeighborhoodEstimated Value: $593,000 - $666,000
3
Beds
2
Baths
2,942
Sq Ft
$213/Sq Ft
Est. Value
About This Home
This home is located at 7291 Sycamore Farm Rd, West Jordan, UT 84081 and is currently estimated at $625,813, approximately $212 per square foot. 7291 Sycamore Farm Rd is a home located in Salt Lake County with nearby schools including Sunset Ridge Middle School, Copper Hills High School, and Ascent Academies of Utah West Jordan.
Ownership History
Date
Name
Owned For
Owner Type
Purchase Details
Closed on
Jul 9, 2024
Sold by
Alder Clair Gerald and Alder Ranuta
Bought by
Clair Gerald Alder And Ranuta Alder Trust and Alder
Current Estimated Value
Purchase Details
Closed on
Nov 6, 2023
Sold by
Mindy Lindquist Living Trust
Bought by
Alder Clair Gerald and Alder Ranuta
Home Financials for this Owner
Home Financials are based on the most recent Mortgage that was taken out on this home.
Original Mortgage
$457,500
Interest Rate
7.19%
Mortgage Type
New Conventional
Purchase Details
Closed on
Oct 3, 2022
Sold by
Lindquist Mindy
Bought by
Mindy Lindquist Living Trust
Purchase Details
Closed on
Mar 5, 2021
Sold by
Lindquist Mindy
Bought by
Lindquist Mindy D
Home Financials for this Owner
Home Financials are based on the most recent Mortgage that was taken out on this home.
Original Mortgage
$145,000
Interest Rate
2.7%
Mortgage Type
New Conventional
Purchase Details
Closed on
Apr 16, 2020
Sold by
Lindquist Mindy and Jeffery David Lindquist Trust
Bought by
Lindquist Mindy
Purchase Details
Closed on
Jan 24, 2006
Sold by
Hardy Construction & Development Inc
Bought by
Lindquist Jeffrey D and Lindquist Mindy D
Home Financials for this Owner
Home Financials are based on the most recent Mortgage that was taken out on this home.
Original Mortgage
$36,794
Interest Rate
6.28%
Mortgage Type
Credit Line Revolving
Purchase Details
Closed on
Jun 29, 2005
Sold by
Jordan Hills Villages Llc
Bought by
Hardy Construction & Development Inc
Home Financials for this Owner
Home Financials are based on the most recent Mortgage that was taken out on this home.
Original Mortgage
$227,800
Interest Rate
5.65%
Mortgage Type
Construction
Create a Home Valuation Report for This Property
The Home Valuation Report is an in-depth analysis detailing your home's value as well as a comparison with similar homes in the area
Home Values in the Area
Average Home Value in this Area
Purchase History
| Date | Buyer | Sale Price | Title Company |
|---|---|---|---|
| Clair Gerald Alder And Ranuta Alder Trust | -- | None Listed On Document | |
| Alder Clair Gerald | -- | Hickman Land Title Company | |
| Mindy Lindquist Living Trust | -- | -- | |
| Lindquist Mindy D | -- | Benchmark Title Ins Agcy | |
| Lindquist Mindy | -- | None Available | |
| Lindquist Jeffery David | -- | None Available | |
| Lindquist Jeffrey D | -- | Surety Title | |
| Hardy Construction & Development Inc | -- | Metro National Title |
Source: Public Records
Mortgage History
| Date | Status | Borrower | Loan Amount |
|---|---|---|---|
| Previous Owner | Alder Clair Gerald | $457,500 | |
| Previous Owner | Lindquist Mindy D | $145,000 | |
| Previous Owner | Lindquist Jeffrey D | $36,794 | |
| Previous Owner | Hardy Construction & Development Inc | $227,800 |
Source: Public Records
Tax History Compared to Growth
Tax History
| Year | Tax Paid | Tax Assessment Tax Assessment Total Assessment is a certain percentage of the fair market value that is determined by local assessors to be the total taxable value of land and additions on the property. | Land | Improvement |
|---|---|---|---|---|
| 2025 | $2,923 | $579,100 | $180,000 | $399,100 |
| 2024 | $2,923 | $562,400 | $174,800 | $387,600 |
| 2023 | $2,974 | $539,300 | $168,100 | $371,200 |
| 2022 | $3,077 | $548,900 | $164,800 | $384,100 |
| 2021 | $2,581 | $419,200 | $129,800 | $289,400 |
| 2020 | $2,402 | $366,100 | $129,800 | $236,300 |
| 2019 | $2,422 | $362,000 | $129,800 | $232,200 |
| 2018 | $2,288 | $339,100 | $127,700 | $211,400 |
| 2017 | $2,162 | $319,000 | $127,700 | $191,300 |
| 2016 | $2,157 | $299,100 | $124,600 | $174,500 |
| 2015 | $2,247 | $303,800 | $127,000 | $176,800 |
| 2014 | $2,053 | $273,300 | $115,100 | $158,200 |
Source: Public Records
Map
Nearby Homes
- 7106 W 7800 S Unit 250
- 8169 S Flaxton Ln
- 7953 S 7110 W
- 7171 W 8170 S
- 7182 Moorepark Place Unit 10
- 7176 Moorepark Place
- 7169 Moorepark Place
- 7853 Flattop Mount Dr Unit 356
- 7069 W Cottage Point Dr
- 7776 S Iron Core Ln
- 7011 W Saw Timber Way
- 7092 W Jayson Bend Dr
- 7009 W 7895 S
- Witzel Plan at The Sycamores
- Beatrix Plan at The Sycamores
- Sweetwater Plan at The Sycamores
- Princeton Plan at The Sycamores
- Dakota Plan at The Sycamores
- Dashell Plan at The Sycamores
- Roosevelt Plan at The Sycamores
- 7277 W Sycamore Farm Rd
- 7277 Sycamore Farm Rd
- 7309 Sycamore Farm Rd
- 7309 W Sycamore Farm Rd
- 7292 W Ramford Way
- 7276 W Ramford Way
- 7292 Ramford Way
- 7304 Ramford Way
- 7276 Ramford Way
- 7991 S 7320 W
- 7272 Sycamore Farm Rd
- 7272 W Sycamore Farm Rd
- 7263 W Sycamore Farm Rd
- 7263 Sycamore Farm Rd
- 7264 W Ramford Way
- 7264 Ramford Way
- 7977 S 7320 W
- 7283 Ramford Way
- 7978 S 7260 W
- 7273 Ramford Way