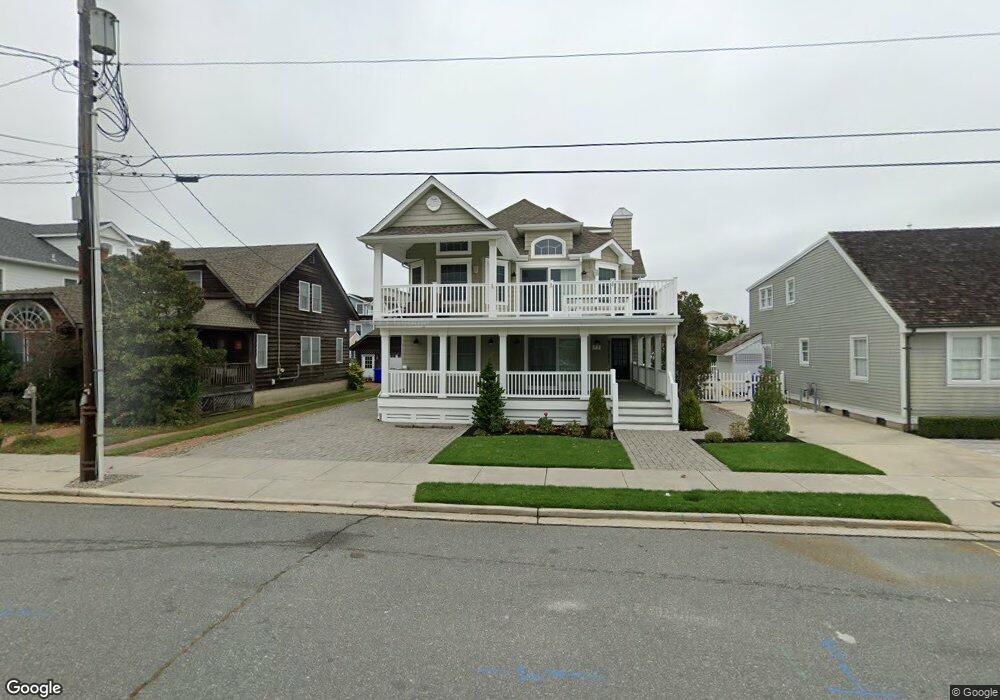
73 17th St E Avalon, NJ 08202
Estimated Value: $5,176,000 - $6,101,000
Studio
--
Bath
3,742
Sq Ft
$1,495/Sq Ft
Est. Value
About This Home
This home is located at 73 17th St E, Avalon, NJ 08202 and is currently estimated at $5,595,428, approximately $1,495 per square foot. 73 17th St E is a home located in Cape May County with nearby schools including Avalon Elementary School.
Ownership History
Date
Name
Owned For
Owner Type
Purchase Details
Closed on
Dec 8, 2016
Sold by
Haggerty Cecelia L
Bought by
Haggerty Cecelia L and Mcgrath Jean H
Current Estimated Value
Purchase Details
Closed on
Jun 30, 1994
Sold by
Donahoe Girard R
Bought by
Hoggerty James J and Haggerty Cecilia L
Home Financials for this Owner
Home Financials are based on the most recent Mortgage that was taken out on this home.
Original Mortgage
$500,000
Interest Rate
8.55%
Create a Home Valuation Report for This Property
The Home Valuation Report is an in-depth analysis detailing your home's value as well as a comparison with similar homes in the area
Home Values in the Area
Average Home Value in this Area
Purchase History
| Date | Buyer | Sale Price | Title Company |
|---|---|---|---|
| Haggerty Cecelia L | -- | None Available | |
| Hoggerty James J | $658,750 | -- |
Source: Public Records
Mortgage History
| Date | Status | Borrower | Loan Amount |
|---|---|---|---|
| Previous Owner | Hoggerty James J | $500,000 |
Source: Public Records
Tax History
| Year | Tax Paid | Tax Assessment Tax Assessment Total Assessment is a certain percentage of the fair market value that is determined by local assessors to be the total taxable value of land and additions on the property. | Land | Improvement |
|---|---|---|---|---|
| 2025 | $20,654 | $3,363,800 | $2,445,000 | $918,800 |
| 2024 | $20,654 | $3,363,800 | $2,445,000 | $918,800 |
| 2023 | $20,486 | $3,363,800 | $2,445,000 | $918,800 |
| 2022 | $19,106 | $3,363,800 | $2,445,000 | $918,800 |
| 2021 | $12,835 | $3,363,800 | $2,445,000 | $918,800 |
| 2020 | $17,694 | $3,363,800 | $2,445,000 | $918,800 |
| 2019 | $17,155 | $3,363,800 | $2,445,000 | $918,800 |
| 2018 | $16,415 | $3,363,800 | $2,445,000 | $918,800 |
| 2017 | $16,083 | $2,892,700 | $1,980,000 | $912,700 |
| 2016 | $15,910 | $2,892,700 | $1,980,000 | $912,700 |
| 2015 | $15,650 | $2,892,700 | $1,980,000 | $912,700 |
| 2014 | $15,476 | $2,892,700 | $1,980,000 | $912,700 |
Source: Public Records
Map
Nearby Homes
Your Personal Tour Guide
Ask me questions while you tour the home.