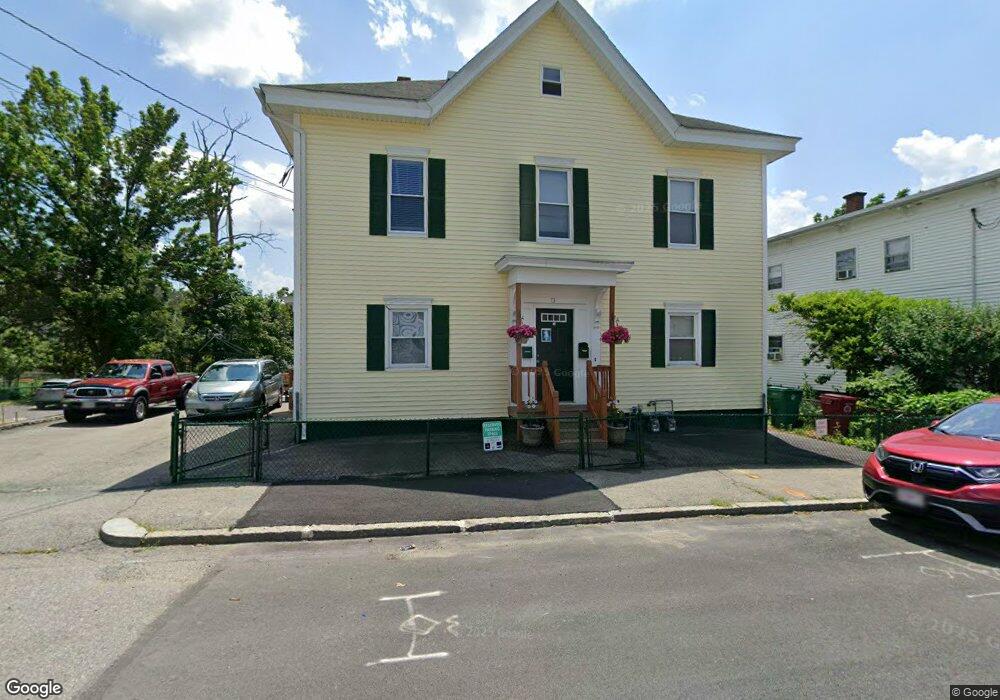
73 3rd St Lowell, MA 01850
Centralville NeighborhoodEstimated Value: $612,000 - $682,000
6
Beds
2
Baths
2,811
Sq Ft
$226/Sq Ft
Est. Value
About This Home
This home is located at 73 3rd St, Lowell, MA 01850 and is currently estimated at $634,413, approximately $225 per square foot. 73 3rd St is a home located in Middlesex County with nearby schools including Greenhalge Elementary School, S. Christa McAuliffe Elementary School, and Moody Elementary School.
Ownership History
Date
Name
Owned For
Owner Type
Purchase Details
Closed on
May 24, 2000
Sold by
Ortiz Juanita and Colon-Padua Damian
Bought by
Ayalla Reynaldo and Morales Lourdes
Current Estimated Value
Home Financials for this Owner
Home Financials are based on the most recent Mortgage that was taken out on this home.
Original Mortgage
$120,000
Outstanding Balance
$41,337
Interest Rate
8.1%
Mortgage Type
Purchase Money Mortgage
Estimated Equity
$593,076
Purchase Details
Closed on
May 28, 1999
Sold by
Noun Henry B
Bought by
Colon-Padua Damian and Ortiz Juanita
Purchase Details
Closed on
Jan 16, 1996
Sold by
Heng Soeun
Bought by
Noun Henry B
Purchase Details
Closed on
Nov 16, 1987
Sold by
Jones David P
Bought by
Heng Soeun
Create a Home Valuation Report for This Property
The Home Valuation Report is an in-depth analysis detailing your home's value as well as a comparison with similar homes in the area
Home Values in the Area
Average Home Value in this Area
Purchase History
| Date | Buyer | Sale Price | Title Company |
|---|---|---|---|
| Ayalla Reynaldo | $150,000 | -- | |
| Ayalla Reynaldo | $150,000 | -- | |
| Colon-Padua Damian | $130,000 | -- | |
| Colon-Padua Damian | $130,000 | -- | |
| Noun Henry B | $38,000 | -- | |
| Noun Henry B | $38,000 | -- | |
| Heng Soeun | $154,000 | -- |
Source: Public Records
Mortgage History
| Date | Status | Borrower | Loan Amount |
|---|---|---|---|
| Open | Heng Soeun | $15,000 | |
| Open | Heng Soeun | $120,000 |
Source: Public Records
Tax History
| Year | Tax Paid | Tax Assessment Tax Assessment Total Assessment is a certain percentage of the fair market value that is determined by local assessors to be the total taxable value of land and additions on the property. | Land | Improvement |
|---|---|---|---|---|
| 2025 | $7,507 | $653,900 | $153,800 | $500,100 |
| 2024 | $6,784 | $569,600 | $127,700 | $441,900 |
| 2023 | $6,312 | $508,200 | $111,100 | $397,100 |
| 2022 | $5,678 | $447,400 | $88,400 | $359,000 |
| 2021 | $5,266 | $391,200 | $76,900 | $314,300 |
| 2020 | $4,896 | $366,500 | $76,900 | $289,600 |
| 2019 | $4,409 | $314,000 | $66,100 | $247,900 |
| 2018 | $4,088 | $284,100 | $63,000 | $221,100 |
| 2017 | $3,797 | $254,500 | $52,900 | $201,600 |
| 2016 | $3,896 | $257,000 | $55,400 | $201,600 |
| 2015 | $3,601 | $232,600 | $57,000 | $175,600 |
| 2013 | $3,253 | $216,700 | $68,700 | $148,000 |
Source: Public Records
Map
Nearby Homes
- 25 Read St
- 94 1st St Unit 10
- 105 3rd St
- 27-29 Fifth St
- 192 1st St
- 45 W 4th St
- 3 Vernon St
- 99 W 6th St
- 106 Methuen St Unit B
- 130 John St Unit G45
- 130 John St Unit 350
- 130 John St Unit G01
- 130 John St Unit 242
- 130 John St Unit 250
- 10 Kearney Square Unit 407
- Lots 1-12 Christian Hill Dev
- Lot 11 Christian St
- Lot 12 Christian St
- Lot 9 Christian St
- Lot 10 Christian St
Your Personal Tour Guide
Ask me questions while you tour the home.