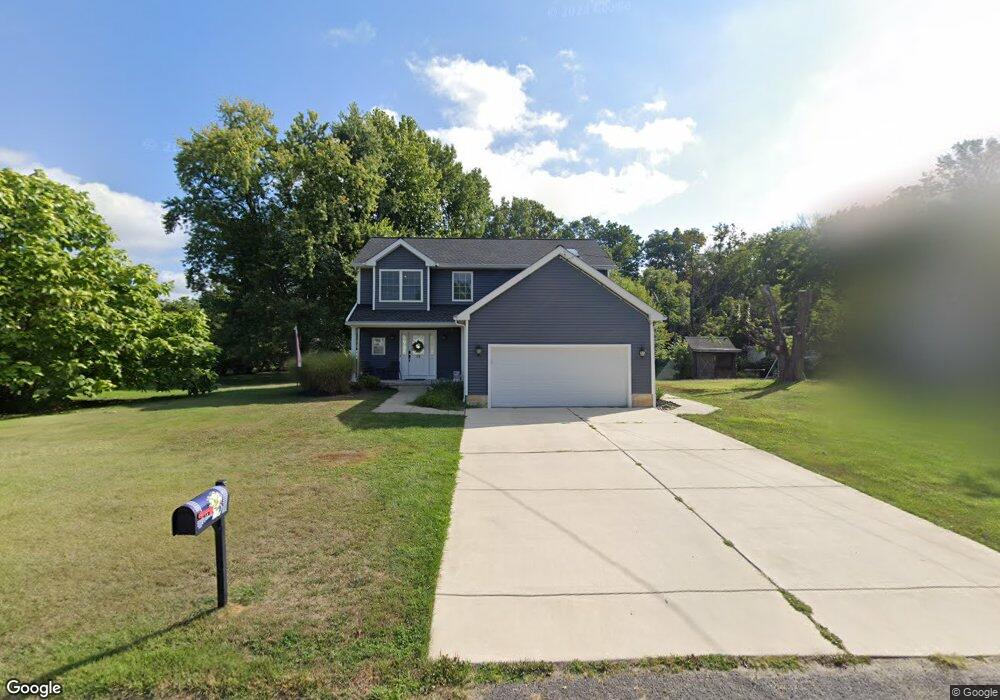
73 8th St Marlton, NJ 08053
Estimated Value: $544,000 - $616,000
4
Beds
3
Baths
1,956
Sq Ft
$294/Sq Ft
Est. Value
About This Home
This home is located at 73 8th St, Marlton, NJ 08053 and is currently estimated at $574,598, approximately $293 per square foot. 73 8th St is a home located in Burlington County with nearby schools including Robert B. Jaggard School, Marlton Middle School, and Cherokee High School.
Ownership History
Date
Name
Owned For
Owner Type
Purchase Details
Closed on
Jul 29, 2011
Sold by
Delucca Ceith J
Bought by
Wallace Steven W and Wallace Paula Kaye
Current Estimated Value
Home Financials for this Owner
Home Financials are based on the most recent Mortgage that was taken out on this home.
Original Mortgage
$218,000
Outstanding Balance
$150,518
Interest Rate
4.51%
Mortgage Type
New Conventional
Estimated Equity
$424,080
Purchase Details
Closed on
Nov 22, 2002
Sold by
Delucca Brandi R
Bought by
Delucca Ceith J
Home Financials for this Owner
Home Financials are based on the most recent Mortgage that was taken out on this home.
Original Mortgage
$103,194
Interest Rate
6.17%
Purchase Details
Closed on
Jul 8, 1997
Sold by
Delucca Ceith J
Bought by
Delucca Ceith J and Delucca Brandi R
Home Financials for this Owner
Home Financials are based on the most recent Mortgage that was taken out on this home.
Original Mortgage
$45,000
Interest Rate
7.37%
Create a Home Valuation Report for This Property
The Home Valuation Report is an in-depth analysis detailing your home's value as well as a comparison with similar homes in the area
Home Values in the Area
Average Home Value in this Area
Purchase History
| Date | Buyer | Sale Price | Title Company |
|---|---|---|---|
| Wallace Steven W | $272,500 | Integrity Title Agency Inc | |
| Delucca Ceith J | -- | -- | |
| Delucca Ceith J | -- | -- |
Source: Public Records
Mortgage History
| Date | Status | Borrower | Loan Amount |
|---|---|---|---|
| Open | Wallace Steven W | $218,000 | |
| Previous Owner | Delucca Ceith J | $103,194 | |
| Previous Owner | Delucca Ceith J | $45,000 |
Source: Public Records
Tax History
| Year | Tax Paid | Tax Assessment Tax Assessment Total Assessment is a certain percentage of the fair market value that is determined by local assessors to be the total taxable value of land and additions on the property. | Land | Improvement |
|---|---|---|---|---|
| 2025 | $10,337 | $302,700 | $96,700 | $206,000 |
| 2024 | $9,726 | $302,700 | $96,700 | $206,000 |
| 2023 | $9,726 | $302,700 | $96,700 | $206,000 |
| 2022 | $9,290 | $302,700 | $96,700 | $206,000 |
| 2021 | $9,072 | $302,700 | $96,700 | $206,000 |
| 2020 | $8,954 | $302,700 | $96,700 | $206,000 |
| 2019 | $8,864 | $302,100 | $96,700 | $205,400 |
| 2018 | $8,740 | $302,100 | $96,700 | $205,400 |
| 2017 | $8,637 | $302,100 | $96,700 | $205,400 |
| 2016 | $8,426 | $302,100 | $96,700 | $205,400 |
| 2015 | $8,278 | $302,100 | $96,700 | $205,400 |
| 2014 | $8,042 | $302,100 | $96,700 | $205,400 |
Source: Public Records
Map
Nearby Homes
- 1315 Marlton Pike
- 203 Quail Rd Unit 203
- 1506 Squirrel Rd Unit 1506
- 1708 Squirrel Rd Unit 1708
- 2205 Delancey Way Unit 2205
- 1207 Delancey Way Unit 1207
- 5903 Baltimore Dr
- 37 Alexandra Ct
- 16 Lowell Dr
- 10 Larkspur Dr
- 20 Longhurst Rd
- 50 Autumn Park Dr
- 49 Eddy Way
- 31 Eddy Way
- 1 Autumn Park Blvd
- 8 Greenbrook Dr
- 14 Crofton Chase Ct
- 42 Hornsby Dr
- 23 Lancaster Dr
- 17 Goldenrod Ln
- 1841 Jefferson Ave
- 56 9th St
- 75 8th St
- 65 8th St
- 70 8th St
- 1830 Old Marlton Pike E
- 1820 Jefferson Ave
- 1840 Old Marlton Pike E
- 1830 Marlton Pike
- 1701 Jefferson Ave
- 1740 Marlton Pike
- 1700 Roosevelt Ave
- 1740 Old Marlton Pike E
- 1715 Roosevelt Ave
- 86 8th St
- 1900 Old Marlton Pike E
- 89 8th St
- 76 10th St
- 1900 Marlton Pike
- 8 8th St
Your Personal Tour Guide
Ask me questions while you tour the home.