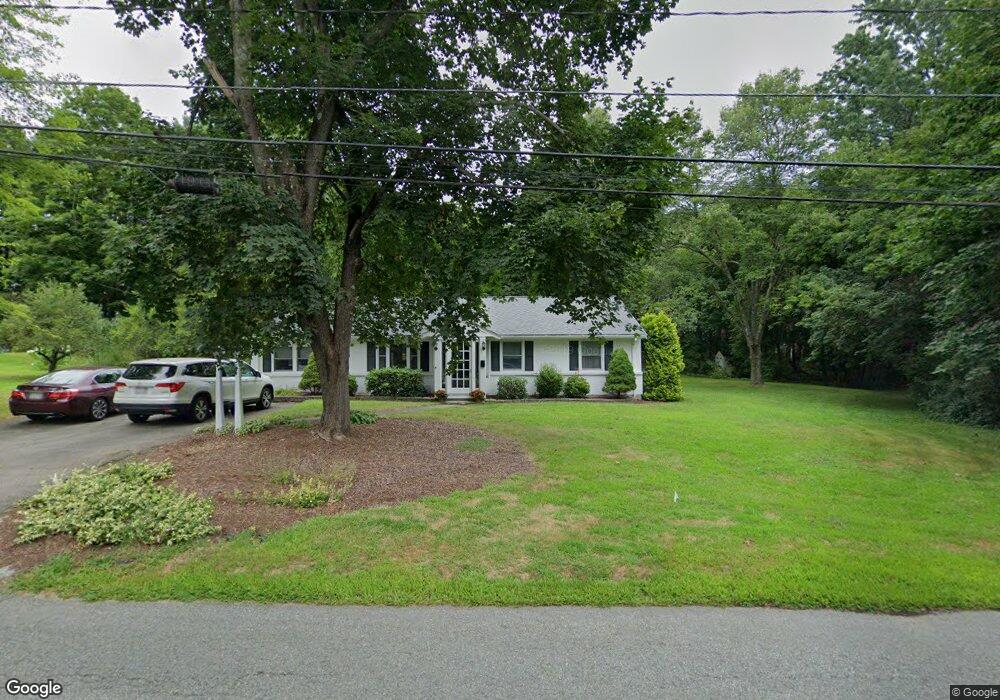
73 Adams St Medfield, MA 02052
Estimated Value: $760,000 - $805,000
3
Beds
2
Baths
1,384
Sq Ft
$566/Sq Ft
Est. Value
About This Home
This home is located at 73 Adams St, Medfield, MA 02052 and is currently estimated at $783,895, approximately $566 per square foot. 73 Adams St is a home located in Norfolk County with nearby schools including Memorial School, Ralph Wheelock School, and Dale Street School.
Ownership History
Date
Name
Owned For
Owner Type
Purchase Details
Closed on
May 22, 2014
Sold by
Conder George and Conder Ty
Bought by
Conder Ty and Conder Kathleen
Current Estimated Value
Purchase Details
Closed on
Dec 1, 2011
Sold by
Frankel Daniel and Frankel Martha M
Bought by
Conder Ty and Conder Kathleen
Purchase Details
Closed on
Jun 23, 2004
Sold by
Vaclavik Kathleen M and Vaclavik Russell E
Bought by
Frankel Daniel and Frankel Martha M
Home Financials for this Owner
Home Financials are based on the most recent Mortgage that was taken out on this home.
Original Mortgage
$324,000
Interest Rate
6.32%
Mortgage Type
Purchase Money Mortgage
Purchase Details
Closed on
Aug 29, 1997
Sold by
Buchanan James M and Buchanan Nora
Bought by
Vaclivik Russell E
Purchase Details
Closed on
May 26, 1989
Sold by
Brewer Michael W
Bought by
Buchanan James M
Create a Home Valuation Report for This Property
The Home Valuation Report is an in-depth analysis detailing your home's value as well as a comparison with similar homes in the area
Home Values in the Area
Average Home Value in this Area
Purchase History
| Date | Buyer | Sale Price | Title Company |
|---|---|---|---|
| Conder Ty | -- | -- | |
| Conder Ty | -- | -- | |
| Conder Ty | $369,000 | -- | |
| Conder Ty | $369,000 | -- | |
| Frankel Daniel | $405,000 | -- | |
| Frankel Daniel | $405,000 | -- | |
| Vaclivik Russell E | $196,000 | -- | |
| Vaclivik Russell E | $196,000 | -- | |
| Buchanan James M | $176,000 | -- | |
| Buchanan James M | $176,000 | -- |
Source: Public Records
Mortgage History
| Date | Status | Borrower | Loan Amount |
|---|---|---|---|
| Previous Owner | Buchanan James M | $320,000 | |
| Previous Owner | Frankel Daniel | $324,000 | |
| Previous Owner | Frankel Daniel | $40,500 |
Source: Public Records
Tax History Compared to Growth
Tax History
| Year | Tax Paid | Tax Assessment Tax Assessment Total Assessment is a certain percentage of the fair market value that is determined by local assessors to be the total taxable value of land and additions on the property. | Land | Improvement |
|---|---|---|---|---|
| 2025 | $9,202 | $666,800 | $409,800 | $257,000 |
| 2024 | $8,862 | $605,300 | $376,600 | $228,700 |
| 2023 | $8,767 | $568,200 | $357,800 | $210,400 |
| 2022 | $8,579 | $492,500 | $339,000 | $153,500 |
| 2021 | $8,280 | $466,200 | $329,500 | $136,700 |
| 2020 | $8,161 | $457,700 | $325,800 | $131,900 |
| 2019 | $7,916 | $443,000 | $316,400 | $126,600 |
| 2018 | $7,064 | $414,800 | $296,800 | $118,000 |
| 2017 | $6,891 | $408,000 | $290,000 | $118,000 |
| 2016 | $6,802 | $406,100 | $288,100 | $118,000 |
| 2015 | $6,286 | $391,900 | $286,000 | $105,900 |
| 2014 | $5,563 | $345,100 | $239,200 | $105,900 |
Source: Public Records
Map
Nearby Homes
- 14 Harding St
- 8 Turtlebrook Way
- 21 Winter St
- 46 Frairy St
- 80 West St
- 34 Frairy St
- 75 Bridge St
- 435 Main St Unit B
- 431 Main St Unit 5
- 3 Shining Valley Cir
- 21 Philip St
- 15 Belknap Rd
- 2 Partridge Hill Rd
- 40 Grand Hill Dr
- 8 Hamlins Crossing
- 00000 S Main St and Bullard St
- 94 Elm St
- 6 Rivendell Ln
- 144 Pine St
- 114 Farm St