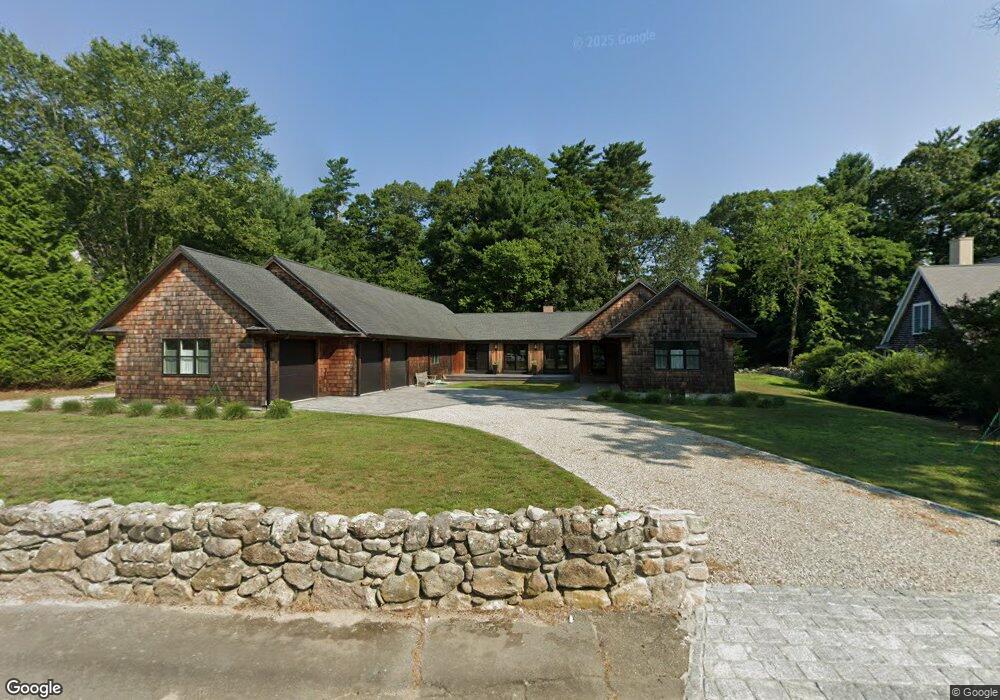
73 Allen St Marion, MA 02738
Marion Center NeighborhoodEstimated Value: $803,000 - $1,731,378
2
Beds
2
Baths
1,820
Sq Ft
$718/Sq Ft
Est. Value
About This Home
This home is located at 73 Allen St, Marion, MA 02738 and is currently estimated at $1,306,095, approximately $717 per square foot. 73 Allen St is a home located in Plymouth County with nearby schools including Old Rochester Regional High School and Tabor Academy.
Ownership History
Date
Name
Owned For
Owner Type
Purchase Details
Closed on
Apr 11, 2024
Sold by
Gee Clark K and Gee Margaret O
Bought by
Gee Ft and Gee
Current Estimated Value
Purchase Details
Closed on
Aug 6, 2009
Sold by
Gee Clark K
Bought by
Gee Clark K and Gee Margaret O
Purchase Details
Closed on
Apr 10, 2009
Sold by
Marion Rt and Reed
Bought by
Gee Clark K
Purchase Details
Closed on
Jun 7, 1996
Sold by
73 Allen Street Nt and Schaefer
Bought by
Marion Rt and Reed
Create a Home Valuation Report for This Property
The Home Valuation Report is an in-depth analysis detailing your home's value as well as a comparison with similar homes in the area
Home Values in the Area
Average Home Value in this Area
Purchase History
| Date | Buyer | Sale Price | Title Company |
|---|---|---|---|
| Gee Ft | -- | None Available | |
| Gee Ft | -- | None Available | |
| Gee Clark K | -- | -- | |
| Gee Clark K | -- | -- | |
| Gee Clark K | $410,000 | -- | |
| Gee Clark K | $410,000 | -- | |
| Marion Rt | $200,000 | -- |
Source: Public Records
Tax History
| Year | Tax Paid | Tax Assessment Tax Assessment Total Assessment is a certain percentage of the fair market value that is determined by local assessors to be the total taxable value of land and additions on the property. | Land | Improvement |
|---|---|---|---|---|
| 2025 | $12,465 | $1,337,400 | $553,700 | $783,700 |
| 2024 | $10,450 | $1,128,500 | $420,800 | $707,700 |
| 2023 | $10,414 | $1,103,200 | $420,800 | $682,400 |
| 2022 | $7,794 | $718,300 | $289,600 | $428,700 |
| 2021 | $8,149 | $719,900 | $281,100 | $438,800 |
| 2020 | $8,322 | $711,300 | $264,600 | $446,700 |
| 2019 | $7,854 | $712,100 | $286,100 | $426,000 |
| 2018 | $8,179 | $714,300 | $292,400 | $421,900 |
| 2017 | $8,150 | $714,300 | $292,400 | $421,900 |
| 2016 | $8,380 | $740,900 | $292,400 | $448,500 |
| 2015 | $7,753 | $697,800 | $292,400 | $405,400 |
Source: Public Records
Map
Nearby Homes
Your Personal Tour Guide
Ask me questions while you tour the home.