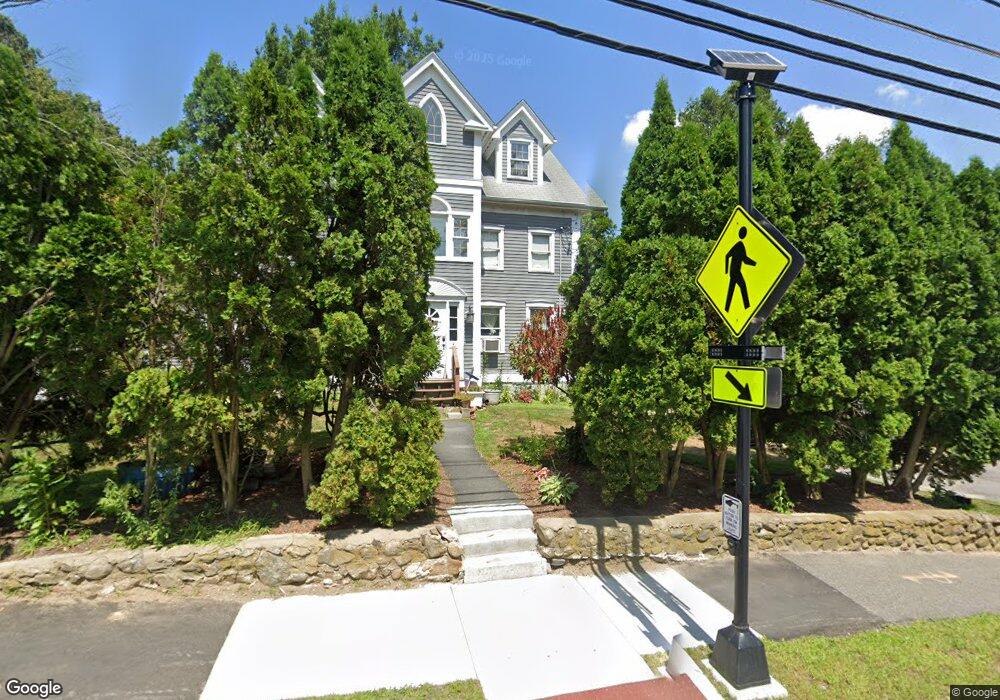
73 Andover St Georgetown, MA 01833
Estimated Value: $747,000 - $872,000
4
Beds
3
Baths
2,945
Sq Ft
$276/Sq Ft
Est. Value
About This Home
This home is located at 73 Andover St, Georgetown, MA 01833 and is currently estimated at $812,107, approximately $275 per square foot. 73 Andover St is a home located in Essex County with nearby schools including Perley Elementary School, Penn Brook School, and Georgetown High School.
Ownership History
Date
Name
Owned For
Owner Type
Purchase Details
Closed on
May 7, 2021
Sold by
Berube Diane M and Berube Thomas J
Bought by
Osorio Diana
Current Estimated Value
Home Financials for this Owner
Home Financials are based on the most recent Mortgage that was taken out on this home.
Original Mortgage
$515,490
Outstanding Balance
$463,170
Interest Rate
3.1%
Mortgage Type
FHA
Estimated Equity
$348,937
Purchase Details
Closed on
Sep 30, 1987
Sold by
Lazdowski Albin
Bought by
Berube Thomas J
Home Financials for this Owner
Home Financials are based on the most recent Mortgage that was taken out on this home.
Original Mortgage
$120,000
Interest Rate
10.31%
Mortgage Type
Purchase Money Mortgage
Create a Home Valuation Report for This Property
The Home Valuation Report is an in-depth analysis detailing your home's value as well as a comparison with similar homes in the area
Home Values in the Area
Average Home Value in this Area
Purchase History
| Date | Buyer | Sale Price | Title Company |
|---|---|---|---|
| Osorio Diana | $539,000 | None Available | |
| Osorio Diana | $539,000 | None Available | |
| Berube Thomas J | $150,000 | -- |
Source: Public Records
Mortgage History
| Date | Status | Borrower | Loan Amount |
|---|---|---|---|
| Open | Osorio Diana | $515,490 | |
| Closed | Osorio Diana | $515,490 | |
| Previous Owner | Berube Thomas J | $150,000 | |
| Previous Owner | Berube Thomas J | $125,000 | |
| Previous Owner | Berube Thomas J | $109,000 | |
| Previous Owner | Berube Thomas J | $120,000 |
Source: Public Records
Tax History
| Year | Tax Paid | Tax Assessment Tax Assessment Total Assessment is a certain percentage of the fair market value that is determined by local assessors to be the total taxable value of land and additions on the property. | Land | Improvement |
|---|---|---|---|---|
| 2025 | $7,569 | $684,400 | $262,000 | $422,400 |
| 2024 | $6,601 | $526,000 | $180,800 | $345,200 |
| 2023 | $7,027 | $541,400 | $180,800 | $360,600 |
| 2022 | $8,010 | $568,900 | $157,100 | $411,800 |
| 2021 | $6,099 | $383,800 | $157,100 | $226,700 |
| 2020 | $6,110 | $383,800 | $157,100 | $226,700 |
| 2019 | $6,007 | $380,700 | $154,000 | $226,700 |
| 2018 | $6,046 | $380,700 | $154,000 | $226,700 |
| 2017 | $5,855 | $361,200 | $154,000 | $207,200 |
| 2016 | $5,872 | $370,000 | $154,000 | $216,000 |
| 2015 | $5,888 | $367,300 | $154,000 | $213,300 |
| 2014 | $5,161 | $367,300 | $154,000 | $213,300 |
Source: Public Records
Map
Nearby Homes
- 11 Central St
- 206 W Main St Unit 5
- 206 W Main St Unit 4
- 206 W Main St Unit 2
- 206 W Main St Unit 3
- 32 Summer St
- 8 Molloy Rd
- 231 W Main St
- 98 West St
- 10 Ashcroft Cir
- 107 King George Dr Unit 9
- 232 School St
- 1 Atwood Ln
- 534 Ipswich Rd
- Lot B Willow Ave
- 901 Alyssa Dr
- 24 Appleton Ln
- 53 Woodcrest Rd
- 427b Ipswich Rd
- 141 Washington St
Your Personal Tour Guide
Ask me questions while you tour the home.