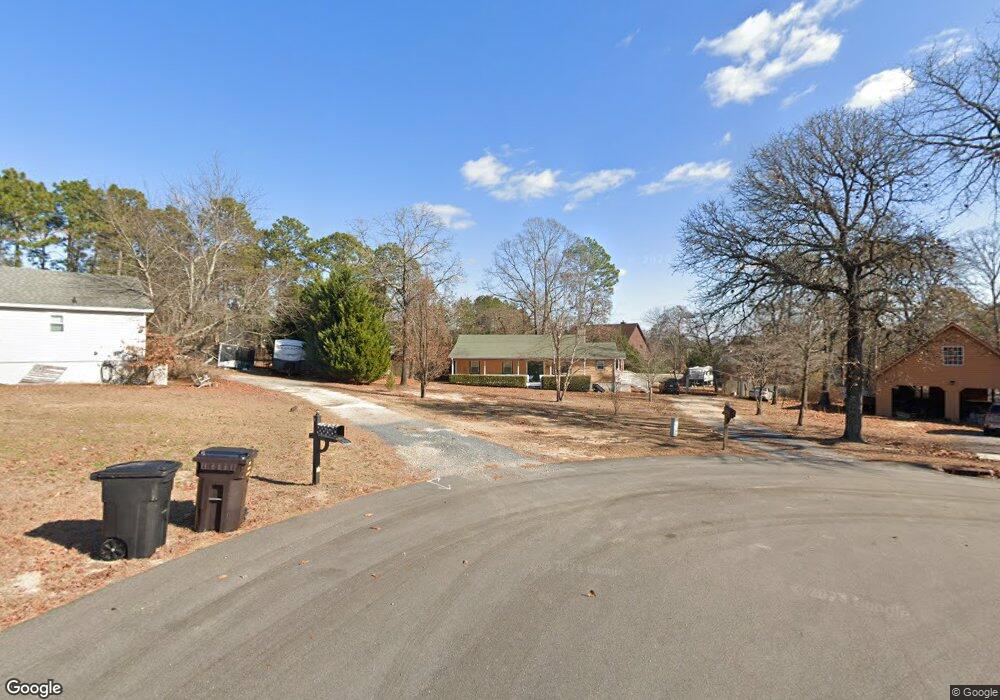
73 Arizona Ct Spring Lake, NC 28390
Estimated Value: $213,000 - $247,651
3
Beds
2
Baths
1,405
Sq Ft
$166/Sq Ft
Est. Value
About This Home
This home is located at 73 Arizona Ct, Spring Lake, NC 28390 and is currently estimated at $232,663, approximately $165 per square foot. 73 Arizona Ct is a home located in Harnett County with nearby schools including Anderson Creek Primary School, South Harnett Elementary School, and Overhills Middle School.
Ownership History
Date
Name
Owned For
Owner Type
Purchase Details
Closed on
Feb 24, 2025
Sold by
Butler Fred S
Bought by
Butler Fred S and Williams Justin Lee
Current Estimated Value
Purchase Details
Closed on
Nov 17, 2023
Sold by
Butler Fred S
Bought by
Butler Fred S
Purchase Details
Closed on
Oct 16, 2017
Sold by
Blumenstein Susan M
Bought by
Butler Fred S
Purchase Details
Closed on
Apr 27, 2009
Sold by
Whetstone Patricia Ann and Everhome Mortgage Co
Bought by
Secretary Of Veterans Affairs
Purchase Details
Closed on
Oct 1, 1995
Bought by
Butler Fred S
Create a Home Valuation Report for This Property
The Home Valuation Report is an in-depth analysis detailing your home's value as well as a comparison with similar homes in the area
Home Values in the Area
Average Home Value in this Area
Purchase History
| Date | Buyer | Sale Price | Title Company |
|---|---|---|---|
| Butler Fred S | -- | None Listed On Document | |
| Butler Fred S | -- | None Listed On Document | |
| Butler Fred S | -- | None Listed On Document | |
| Butler Fred S | -- | None Listed On Document | |
| Butler Fred S | -- | None Available | |
| Secretary Of Veterans Affairs | $95,489 | -- | |
| Butler Fred S | $83,000 | -- |
Source: Public Records
Tax History Compared to Growth
Tax History
| Year | Tax Paid | Tax Assessment Tax Assessment Total Assessment is a certain percentage of the fair market value that is determined by local assessors to be the total taxable value of land and additions on the property. | Land | Improvement |
|---|---|---|---|---|
| 2025 | $1,363 | $182,311 | $0 | $0 |
| 2024 | $1,363 | $182,311 | $0 | $0 |
| 2023 | $1,363 | $182,311 | $0 | $0 |
| 2022 | $1,638 | $182,311 | $0 | $0 |
| 2021 | $1,117 | $121,750 | $0 | $0 |
| 2020 | $1,132 | $121,750 | $0 | $0 |
| 2019 | $1,117 | $121,750 | $0 | $0 |
| 2018 | $817 | $121,750 | $0 | $0 |
| 2017 | $1,117 | $121,750 | $0 | $0 |
| 2016 | $1,138 | $124,150 | $0 | $0 |
| 2015 | $1,138 | $124,150 | $0 | $0 |
| 2014 | $1,138 | $124,150 | $0 | $0 |
Source: Public Records
Map
Nearby Homes