Estimated Value: $273,352 - $309,000
Studio
2
Baths
2,027
Sq Ft
$144/Sq Ft
Est. Value
About This Home
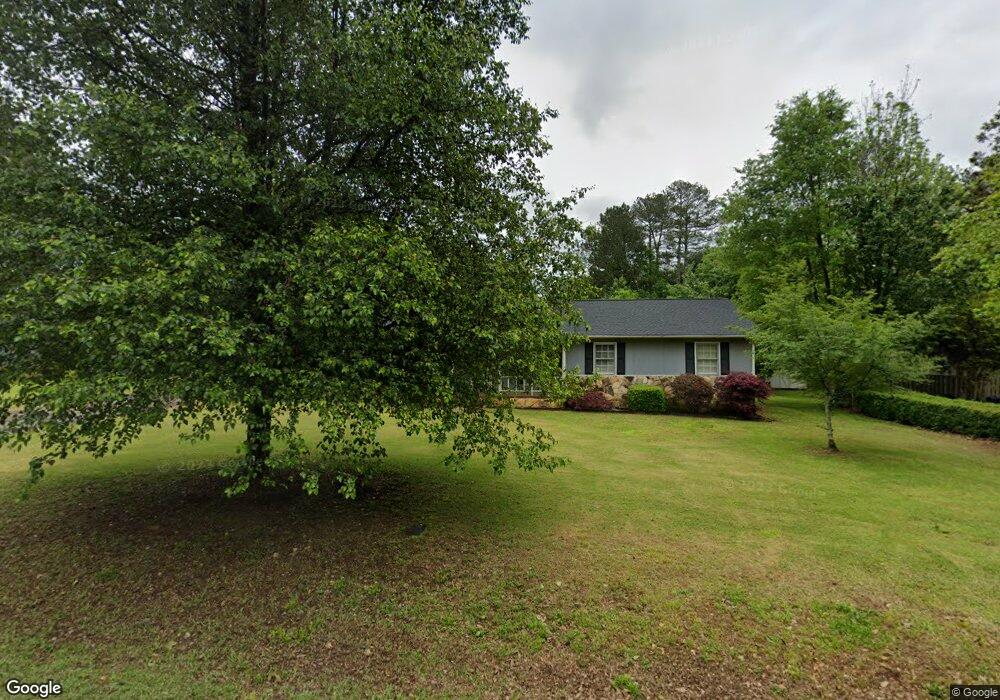
This home is located at 73 Bedford Dr, Hull, GA 30646 and is currently estimated at $292,588, approximately $144 per square foot. 73 Bedford Dr is a home located in Madison County with nearby schools including Madison County High School.
Ownership History
Date
Name
Owned For
Owner Type
Purchase Details
Closed on
Jul 17, 2012
Sold by
Miller Robin Rogers
Bought by
Shafiq Mohammad
Current Estimated Value
Purchase Details
Closed on
Nov 30, 2011
Sold by
Rogers Shirley Inez
Bought by
Rogers Henry Joseph
Purchase Details
Closed on
Nov 23, 1998
Sold by
Rogers Henry J
Bought by
Rogers Henry J and Rogers Inez
Purchase Details
Closed on
Jan 1, 1980
Bought by
Rogers Henry J
Create a Home Valuation Report for This Property
The Home Valuation Report is an in-depth analysis detailing your home's value as well as a comparison with similar homes in the area
Purchase History
| Date | Buyer | Sale Price | Title Company |
|---|---|---|---|
| Shafiq Mohammad | -- | -- | |
| Shafiq Mohammad | $40,000 | -- | |
| Rogers Henry Joseph | -- | -- | |
| Rogers Henry J | -- | -- | |
| Rogers Henry J | -- | -- |
Source: Public Records
Tax History
| Year | Tax Paid | Tax Assessment Tax Assessment Total Assessment is a certain percentage of the fair market value that is determined by local assessors to be the total taxable value of land and additions on the property. | Land | Improvement |
|---|---|---|---|---|
| 2025 | $2,714 | $106,807 | $22,000 | $84,807 |
| 2024 | $24 | $93,844 | $12,320 | $81,524 |
| 2023 | $2,302 | $88,450 | $12,320 | $76,130 |
| 2022 | $2,189 | $79,372 | $12,320 | $67,052 |
| 2021 | $1,842 | $60,338 | $11,200 | $49,138 |
| 2020 | $1,730 | $56,264 | $11,200 | $45,064 |
| 2019 | $1,597 | $51,340 | $9,240 | $42,100 |
| 2018 | $1,562 | $50,077 | $9,240 | $40,837 |
| 2017 | $1,201 | $41,702 | $8,800 | $32,902 |
| 2016 | $1,056 | $36,785 | $8,800 | $27,985 |
| 2015 | $755 | $26,283 | $8,000 | $18,283 |
| 2014 | $761 | $26,348 | $8,000 | $18,348 |
| 2013 | -- | $26,348 | $8,000 | $18,348 |
Source: Public Records
Map
Nearby Homes
- 73 Woodale St
- 789 Glenn Carrie Rd
- 768 Glenn Carrie Rd
- 0 Reese Ln Unit 7703910
- 0 Reese Ln Unit CL346847
- 105 Hidden Lake Ct
- 741 Harve Mathis Rd
- 540 & 542 Harve Mathis Rd
- 8986 Highway 29 S
- 151 Rolling Woods Ln
- 31 Rolling Woods Ln
- 1361 Hull Rd
- 1309 Hull Rd
- 19 Glenn Carrie Rd
- 65 Kimberly Way
- 240 Glenn Carrie Rd Unit 2
- 232 Glenn Carrie Rd Unit 1
- 140 Kimberly Way
- 3080 Danielsville Rd
- 270 Norwood Cir
- 53 Bedford Dr
- 93 Bedford Dr
- 82 Bedford Dr
- 755 Virginia Ln
- 60 Bedford Dr
- 117 Bedford Dr
- 106 Bedford Dr
- 44 Bedford Dr
- 731 Virginia Ln
- 1215 Glenn Carrie Rd
- 55 Kevin Way
- 35 Kevin Way
- 707 Virginia Ln
- 81 Kevin Way
- 7 Bedford Dr
- 1135 Glenn Carrie Rd
- 769 Virginia Ln
- 1283 Glenn Carrie Rd
- 796 Virginia Ln
- Lot 2B Bedford Dr
Your Personal Tour Guide
Ask me questions while you tour the home.