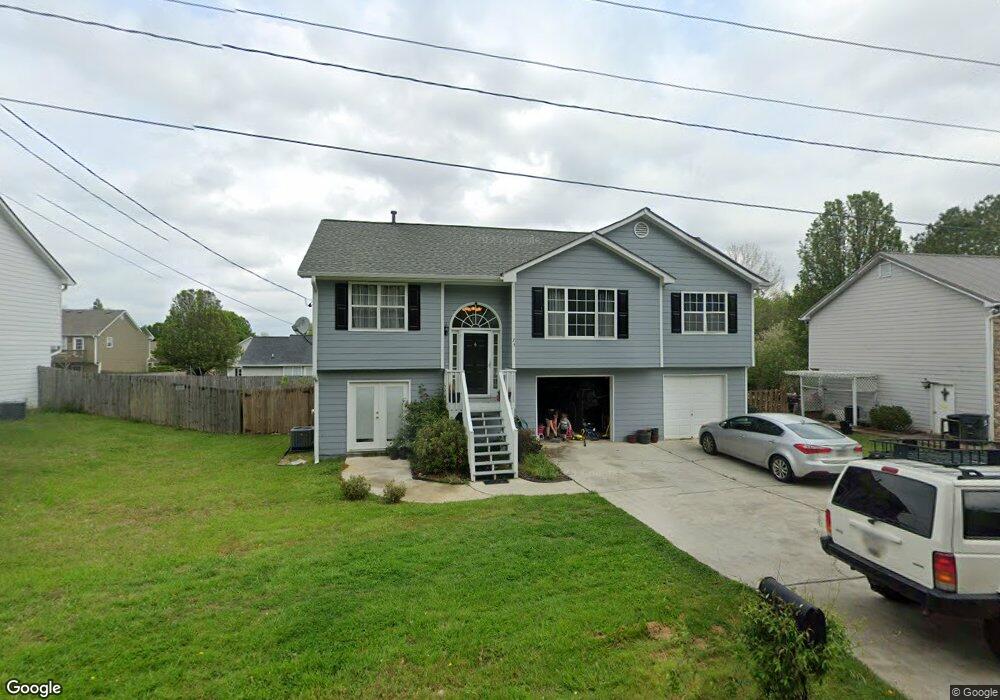
73 Braswell Rd Rockmart, GA 30153
Estimated Value: $208,000 - $227,869
4
Beds
3
Baths
1,180
Sq Ft
$188/Sq Ft
Est. Value
About This Home
This home is located at 73 Braswell Rd, Rockmart, GA 30153 and is currently estimated at $221,967, approximately $188 per square foot. 73 Braswell Rd is a home located in Polk County with nearby schools including Rockmart Middle School.
Ownership History
Date
Name
Owned For
Owner Type
Purchase Details
Closed on
Sep 18, 2009
Sold by
Secretary Of Housing
Bought by
Fierce Richard J
Current Estimated Value
Home Financials for this Owner
Home Financials are based on the most recent Mortgage that was taken out on this home.
Original Mortgage
$66,300
Outstanding Balance
$43,183
Interest Rate
5.11%
Mortgage Type
New Conventional
Estimated Equity
$178,784
Purchase Details
Closed on
Oct 7, 2008
Sold by
Not Provided
Bought by
Fierce Richard and Fierce Candace M
Purchase Details
Closed on
Feb 18, 2004
Sold by
Shaffer Hollie M
Bought by
Philpot Indy B
Purchase Details
Closed on
Aug 23, 2000
Sold by
Hightower Homes Inc
Bought by
Shaffer Hollie M
Purchase Details
Closed on
Apr 19, 2000
Sold by
Hbw Development Llc
Bought by
Hightower Homes Inc
Purchase Details
Closed on
Sep 11, 1998
Bought by
H B W Development Co Llc
Create a Home Valuation Report for This Property
The Home Valuation Report is an in-depth analysis detailing your home's value as well as a comparison with similar homes in the area
Home Values in the Area
Average Home Value in this Area
Purchase History
| Date | Buyer | Sale Price | Title Company |
|---|---|---|---|
| Fierce Richard J | $62,500 | -- | |
| Fierce Richard | -- | -- | |
| Sec Of Housin Gand Urban | $105,825 | -- | |
| Philpot Indy B | $102,500 | -- | |
| Shaffer Hollie M | $87,900 | -- | |
| Hightower Homes Inc | $14,200 | -- | |
| H B W Development Co Llc | -- | -- |
Source: Public Records
Mortgage History
| Date | Status | Borrower | Loan Amount |
|---|---|---|---|
| Open | Fierce Richard J | $66,300 |
Source: Public Records
Tax History Compared to Growth
Tax History
| Year | Tax Paid | Tax Assessment Tax Assessment Total Assessment is a certain percentage of the fair market value that is determined by local assessors to be the total taxable value of land and additions on the property. | Land | Improvement |
|---|---|---|---|---|
| 2024 | $2,506 | $88,007 | $12,000 | $76,007 |
| 2023 | $2,043 | $63,738 | $12,000 | $51,738 |
| 2022 | $1,227 | $51,703 | $6,000 | $45,703 |
| 2021 | $1,243 | $51,703 | $6,000 | $45,703 |
| 2020 | $1,245 | $51,703 | $6,000 | $45,703 |
| 2019 | $1,230 | $45,812 | $5,600 | $40,212 |
| 2018 | $1,127 | $40,916 | $5,600 | $35,316 |
| 2017 | $1,113 | $40,916 | $5,600 | $35,316 |
| 2016 | $1,113 | $40,916 | $5,600 | $35,316 |
| 2015 | $1,117 | $40,916 | $5,600 | $35,316 |
| 2014 | $1,125 | $40,916 | $5,600 | $35,316 |
Source: Public Records
Map
Nearby Homes
- 302 Staci Ln
- 307 Staci Ln
- 11 Lot
- 1012 Fairview Rd
- 7667 Georgia 101
- 247 Litchfield St
- 367 Wingfoot St
- 456 Clearwater St
- 401 Springdale Rd
- 1 Carlton Dr
- 451 Clearwater St
- 530 Hogue Ave
- 522 Jackson St
- 20 Clemons Dr
- 404 Sciple St
- 0 Carlton Dr Unit 25352782
- 97 Sycamore St
- 0 Nathan Dean Bypass Unit 10434274
- 0 Wilson St Unit 7688557
- 0 Wilson St Unit 10652788
- 75 Braswell Rd
- 71 Braswell Rd
- 131 Nicole Cir
- 129 Nicole Cir
- 69 Braswell Rd
- 133 Nicole Cir
- 127 Nicole Cir
- 67 Braswell Rd
- 135 Nicole Cir 0
- 135 Nicole Circle 0
- 135 Nicole Cir
- 130 Nicole Cir
- 125 Nicole Cir
- 65 Braswell Rd
- 300 Staci Ln
- 137 Nicole Cir
- 124 Nicole Cir
- 122 Nicole Cir
- 138 Nicole Cir
- 304 Staci Ln