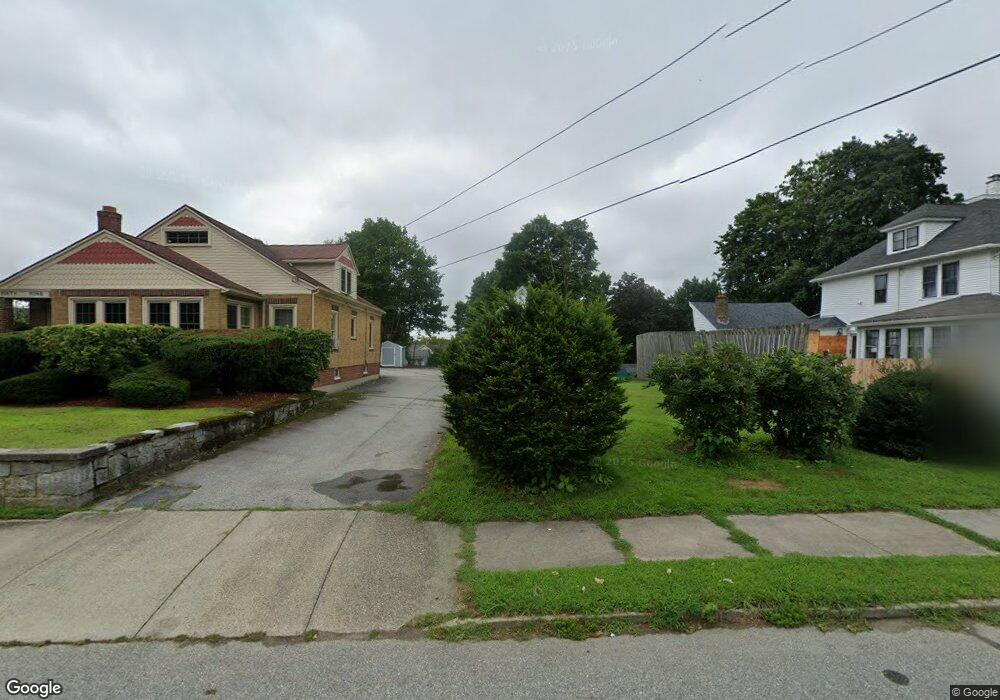
73 Broad St Danielson, CT 06239
Estimated Value: $271,397 - $354,000
3
Beds
2
Baths
1,598
Sq Ft
$188/Sq Ft
Est. Value
About This Home
This home is located at 73 Broad St, Danielson, CT 06239 and is currently estimated at $300,349, approximately $187 per square foot. 73 Broad St is a home located in Windham County with nearby schools including Killingly Central School, Killingly Memorial School, and Killingly Intermediate School.
Ownership History
Date
Name
Owned For
Owner Type
Purchase Details
Closed on
Jun 22, 2001
Sold by
Trudeau Daryn P and Trudeau Erica L
Bought by
Lorenzen Kurt A
Current Estimated Value
Purchase Details
Closed on
Jul 5, 1995
Sold by
Perrin Mark R
Bought by
Trudeau Daryn P and Trudeau Erica
Purchase Details
Closed on
Jun 29, 1994
Sold by
Bunning Thomas
Bought by
Perrin Mark R
Purchase Details
Closed on
Aug 4, 1987
Sold by
Ruel Anna
Bought by
Jansen Robert
Create a Home Valuation Report for This Property
The Home Valuation Report is an in-depth analysis detailing your home's value as well as a comparison with similar homes in the area
Home Values in the Area
Average Home Value in this Area
Purchase History
| Date | Buyer | Sale Price | Title Company |
|---|---|---|---|
| Lorenzen Kurt A | $104,000 | -- | |
| Lorenzen Kurt A | $104,000 | -- | |
| Trudeau Daryn P | $75,000 | -- | |
| Trudeau Daryn P | $75,000 | -- | |
| Perrin Mark R | $58,500 | -- | |
| Perrin Mark R | $58,500 | -- | |
| Jansen Robert | $132,000 | -- |
Source: Public Records
Mortgage History
| Date | Status | Borrower | Loan Amount |
|---|---|---|---|
| Open | Jansen Robert | $148,000 | |
| Closed | Jansen Robert | $80,000 |
Source: Public Records
Tax History
| Year | Tax Paid | Tax Assessment Tax Assessment Total Assessment is a certain percentage of the fair market value that is determined by local assessors to be the total taxable value of land and additions on the property. | Land | Improvement |
|---|---|---|---|---|
| 2025 | $3,275 | $130,750 | $28,750 | $102,000 |
| 2024 | $3,126 | $130,750 | $28,750 | $102,000 |
| 2023 | $2,880 | $89,740 | $23,730 | $66,010 |
| 2022 | $2,709 | $89,740 | $23,730 | $66,010 |
| 2021 | $2,709 | $89,740 | $23,730 | $66,010 |
| 2020 | $2,664 | $89,740 | $23,730 | $66,010 |
| 2019 | $2,693 | $89,740 | $23,730 | $66,010 |
| 2017 | $2,367 | $73,360 | $15,120 | $58,240 |
| 2016 | $2,367 | $73,360 | $15,120 | $58,240 |
| 2015 | $2,319 | $73,360 | $15,120 | $58,240 |
| 2014 | $2,264 | $73,360 | $15,120 | $58,240 |
Source: Public Records
Map
Nearby Homes
Your Personal Tour Guide
Ask me questions while you tour the home.