73 Bryant Point Rd North Falmouth, MA 02556
North Falmouth NeighborhoodEstimated Value: $1,467,000 - $1,697,311
4
Beds
4
Baths
2,688
Sq Ft
$589/Sq Ft
Est. Value
About This Home
This home is located at 73 Bryant Point Rd, North Falmouth, MA 02556 and is currently estimated at $1,584,328, approximately $589 per square foot. 73 Bryant Point Rd is a home located in Barnstable County with nearby schools including North Falmouth Elementary School, Morse Pond School, and Lawrence School.
Ownership History
Date
Name
Owned For
Owner Type
Purchase Details
Closed on
Jun 30, 2016
Sold by
Vollmann Jane T
Bought by
Bannan Kevin A and Bannan Catherine G
Current Estimated Value
Home Financials for this Owner
Home Financials are based on the most recent Mortgage that was taken out on this home.
Original Mortgage
$350,000
Outstanding Balance
$277,896
Interest Rate
3.58%
Mortgage Type
New Conventional
Estimated Equity
$1,306,432
Create a Home Valuation Report for This Property
The Home Valuation Report is an in-depth analysis detailing your home's value as well as a comparison with similar homes in the area
Home Values in the Area
Average Home Value in this Area
Purchase History
| Date | Buyer | Sale Price | Title Company |
|---|---|---|---|
| Bannan Kevin A | $735,000 | -- | |
| Bannan Kevin A | $735,000 | -- | |
| Vollmann Jane T | -- | -- | |
| Vollmann Jane T | -- | -- |
Source: Public Records
Mortgage History
| Date | Status | Borrower | Loan Amount |
|---|---|---|---|
| Open | Bannan Kevin A | $350,000 | |
| Closed | Bannan Kevin A | $350,000 |
Source: Public Records
Tax History Compared to Growth
Tax History
| Year | Tax Paid | Tax Assessment Tax Assessment Total Assessment is a certain percentage of the fair market value that is determined by local assessors to be the total taxable value of land and additions on the property. | Land | Improvement |
|---|---|---|---|---|
| 2025 | $8,135 | $1,385,800 | $821,400 | $564,400 |
| 2024 | $7,559 | $1,203,600 | $711,400 | $492,200 |
| 2023 | $6,853 | $990,300 | $567,100 | $423,200 |
| 2022 | $7,332 | $910,800 | $567,500 | $343,300 |
| 2021 | $6,699 | $788,100 | $485,900 | $302,200 |
| 2020 | $6,390 | $743,900 | $441,700 | $302,200 |
| 2019 | $6,305 | $736,600 | $441,700 | $294,900 |
| 2018 | $6,194 | $720,200 | $441,700 | $278,500 |
| 2017 | $6,054 | $709,700 | $441,700 | $268,000 |
| 2016 | $8,254 | $986,200 | $681,000 | $305,200 |
| 2015 | $8,077 | $986,200 | $681,000 | $305,200 |
| 2014 | $7,853 | $963,500 | $681,100 | $282,400 |
Source: Public Records
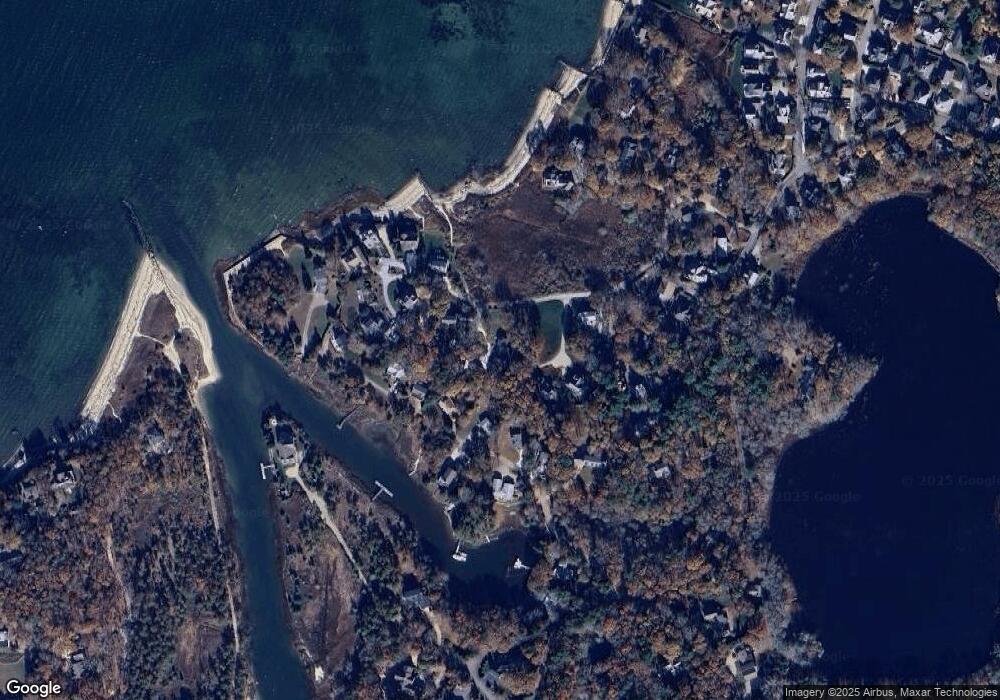
Map
Nearby Homes
- 24 Fiddlers Cove Rd
- 2 Tricia Rd
- 14 Ryder Rd
- 48 Garnet Ave
- 289 Old Main Rd
- 37 Five Gate Ln
- 9 Seascape Ln
- 74 Hillside Ave
- 23 Wohelo Dr
- 250 Scraggy Neck Rd
- 10 Squeteague Harbor Rd
- 31 Baxendale Rd
- 75 Winsor Rd
- 24 Westwood Rd
- 267 N Falmouth Hwy
- 40 Point Rd
- 213 N Falmouth Hwy Unit 5A
- 213 N Falmouth Hwy Unit 5B