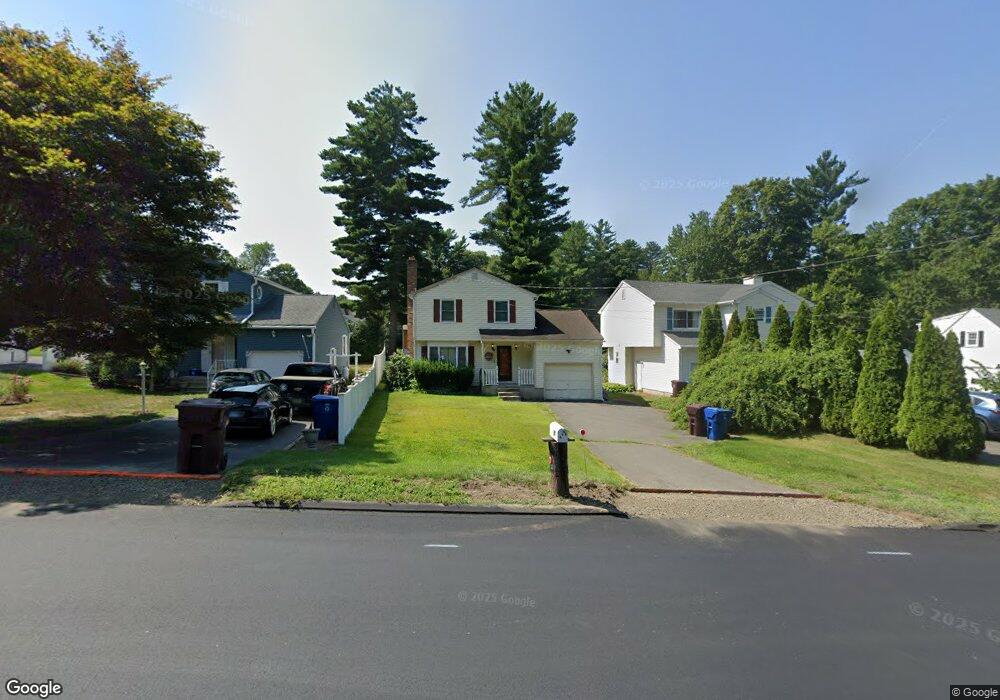
73 Burlington Rd Unionville, CT 06085
Estimated Value: $390,506 - $434,000
3
Beds
2
Baths
1,264
Sq Ft
$326/Sq Ft
Est. Value
About This Home
This home is located at 73 Burlington Rd, Unionville, CT 06085 and is currently estimated at $411,877, approximately $325 per square foot. 73 Burlington Rd is a home located in Hartford County with nearby schools including West Woods Upper Elementary School, Irving A. Robbins Middle School, and Farmington High School.
Ownership History
Date
Name
Owned For
Owner Type
Purchase Details
Closed on
Feb 15, 2023
Sold by
Camargo Jacqueline
Bought by
Ayorinde Patrick K and Camargo Jacqueline
Current Estimated Value
Purchase Details
Closed on
Aug 28, 2007
Sold by
Banasiak Ivona B and Banasiak Jerzy B
Bought by
Camargo Jacqueline and Guadalupe Juan
Home Financials for this Owner
Home Financials are based on the most recent Mortgage that was taken out on this home.
Original Mortgage
$248,900
Interest Rate
6.78%
Purchase Details
Closed on
Oct 1, 1997
Sold by
Licki Christine A
Bought by
Banasiak Jerzy B and Banasiak Ivona B
Purchase Details
Closed on
Apr 21, 1988
Sold by
Tonucci Richard
Bought by
Licki Christine A
Create a Home Valuation Report for This Property
The Home Valuation Report is an in-depth analysis detailing your home's value as well as a comparison with similar homes in the area
Home Values in the Area
Average Home Value in this Area
Purchase History
| Date | Buyer | Sale Price | Title Company |
|---|---|---|---|
| Ayorinde Patrick K | -- | None Available | |
| Camargo Jacqueline | $262,000 | -- | |
| Banasiak Jerzy B | $125,000 | -- | |
| Licki Christine A | $182,500 | -- |
Source: Public Records
Mortgage History
| Date | Status | Borrower | Loan Amount |
|---|---|---|---|
| Previous Owner | Licki Christine A | $224,200 | |
| Previous Owner | Licki Christine A | $248,900 | |
| Previous Owner | Licki Christine A | $128,000 |
Source: Public Records
Tax History Compared to Growth
Tax History
| Year | Tax Paid | Tax Assessment Tax Assessment Total Assessment is a certain percentage of the fair market value that is determined by local assessors to be the total taxable value of land and additions on the property. | Land | Improvement |
|---|---|---|---|---|
| 2025 | $5,590 | $210,000 | $75,670 | $134,330 |
| 2024 | $5,345 | $210,000 | $75,670 | $134,330 |
| 2023 | $5,084 | $210,000 | $75,670 | $134,330 |
| 2022 | $4,826 | $164,600 | $68,770 | $95,830 |
| 2021 | $4,742 | $164,600 | $68,770 | $95,830 |
| 2020 | $4,604 | $164,600 | $68,770 | $95,830 |
| 2019 | $4,604 | $164,600 | $68,770 | $95,830 |
| 2018 | $4,474 | $164,600 | $68,770 | $95,830 |
| 2017 | $4,137 | $155,050 | $61,990 | $93,060 |
| 2016 | $3,997 | $155,050 | $61,990 | $93,060 |
| 2015 | $3,878 | $155,050 | $61,990 | $93,060 |
| 2014 | $3,790 | $155,080 | $62,020 | $93,060 |
Source: Public Records
Map
Nearby Homes
- 61 Litchfield Rd
- 69 Lake Garda Dr
- 50 E Shore Blvd
- 17 Pine Dr
- 6 Burlington Rd
- 16 Strong St
- 487 Plainville Ave
- 7 Newcastle Place
- 10 Woodside Dr
- 86 Alpine Dr
- 55 Depot Place
- 31 Railroad Ave
- 148 River Rd
- 27 Westview Terrace
- 8919 Taine Mountain Rd
- 220 Monce Rd Unit 17
- 54 Westview Terrace
- 94 Perry St
- 243 New Britain Ave Unit 243
- 10 Stone Ridge Crossing
- 71 Burlington Rd
- 69 Burlington Rd
- 75 Burlington Rd
- 77 Burlington Rd
- 74 Burlington Rd
- 24 Jefferson St
- 2 River Rd
- 85 Burlington Rd
- 22 Jefferson St
- 20 Jefferson St
- 65 Burlington Rd
- 18 Jefferson St
- 87 Burlington Rd
- 66 Burlington Rd
- 30 Jefferson St
- 1 River Rd
- 21 Jefferson St
- 8 Jefferson St
- 64 Burlington Rd
- 89 Burlington Rd