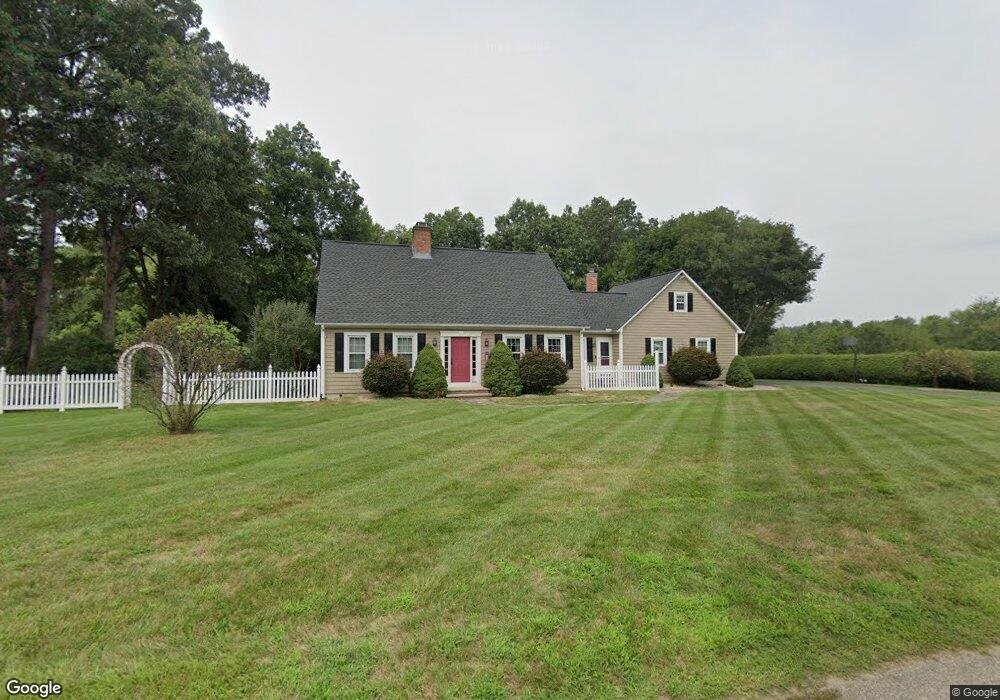
73 Cardinal Cir Ludlow, MA 01056
Estimated Value: $610,933 - $721,000
4
Beds
3
Baths
2,728
Sq Ft
$239/Sq Ft
Est. Value
About This Home
This home is located at 73 Cardinal Cir, Ludlow, MA 01056 and is currently estimated at $651,233, approximately $238 per square foot. 73 Cardinal Cir is a home located in Hampden County with nearby schools including East Street Elementary School, Chapin Street Elementary School, and Paul R. Baird Middle School.
Ownership History
Date
Name
Owned For
Owner Type
Purchase Details
Closed on
Apr 16, 2004
Sold by
Bernardo Omer M
Bought by
Barbeau Lori A and Barbeau Thomas R
Current Estimated Value
Home Financials for this Owner
Home Financials are based on the most recent Mortgage that was taken out on this home.
Original Mortgage
$240,000
Outstanding Balance
$110,601
Interest Rate
5.58%
Mortgage Type
Purchase Money Mortgage
Estimated Equity
$540,632
Purchase Details
Closed on
Oct 18, 1991
Sold by
Bernardo Donna M
Bought by
Bernardo Omer M
Create a Home Valuation Report for This Property
The Home Valuation Report is an in-depth analysis detailing your home's value as well as a comparison with similar homes in the area
Home Values in the Area
Average Home Value in this Area
Purchase History
| Date | Buyer | Sale Price | Title Company |
|---|---|---|---|
| Barbeau Lori A | $379,900 | -- | |
| Barbeau Lori A | $379,900 | -- | |
| Bernardo Omer M | $88,000 | -- |
Source: Public Records
Mortgage History
| Date | Status | Borrower | Loan Amount |
|---|---|---|---|
| Open | Bernardo Omer M | $55,000 | |
| Open | Barbeau Lori A | $240,000 | |
| Closed | Bernardo Omer M | $240,000 |
Source: Public Records
Tax History Compared to Growth
Tax History
| Year | Tax Paid | Tax Assessment Tax Assessment Total Assessment is a certain percentage of the fair market value that is determined by local assessors to be the total taxable value of land and additions on the property. | Land | Improvement |
|---|---|---|---|---|
| 2025 | $9,081 | $523,400 | $105,600 | $417,800 |
| 2024 | $8,741 | $483,200 | $105,600 | $377,600 |
| 2023 | $8,504 | $435,900 | $92,700 | $343,200 |
| 2022 | $8,104 | $405,400 | $92,700 | $312,700 |
| 2021 | $8,139 | $386,100 | $92,700 | $293,400 |
| 2020 | $7,790 | $377,800 | $91,300 | $286,500 |
| 2019 | $7,434 | $375,100 | $90,400 | $284,700 |
| 2018 | $6,944 | $365,300 | $90,400 | $274,900 |
| 2017 | $6,641 | $358,400 | $88,600 | $269,800 |
| 2016 | $6,375 | $351,600 | $86,800 | $264,800 |
| 2015 | $6,026 | $348,500 | $86,000 | $262,500 |
Source: Public Records
Map
Nearby Homes
- '0' Rood St
- 0 Nash Hill Rd
- 665 Center St Unit 705
- 665 Center St Unit 311
- 665 Center St Unit 706
- 166 Kendall St
- 84 Chapin Greene Dr
- 70 Sroka Ln
- 334 Munsing St
- 60 Loopley St
- 42 Loopley St
- 61 Massachusetts Ave
- 41 Deroche Cir
- 436 Holyoke St
- 98 Fuller St Unit 32
- 84 Fuller St Unit 2
- 84 Fuller St Unit 1
- 482 Holyoke St
- 173 Colonial Dr
- 350 West St Unit 19