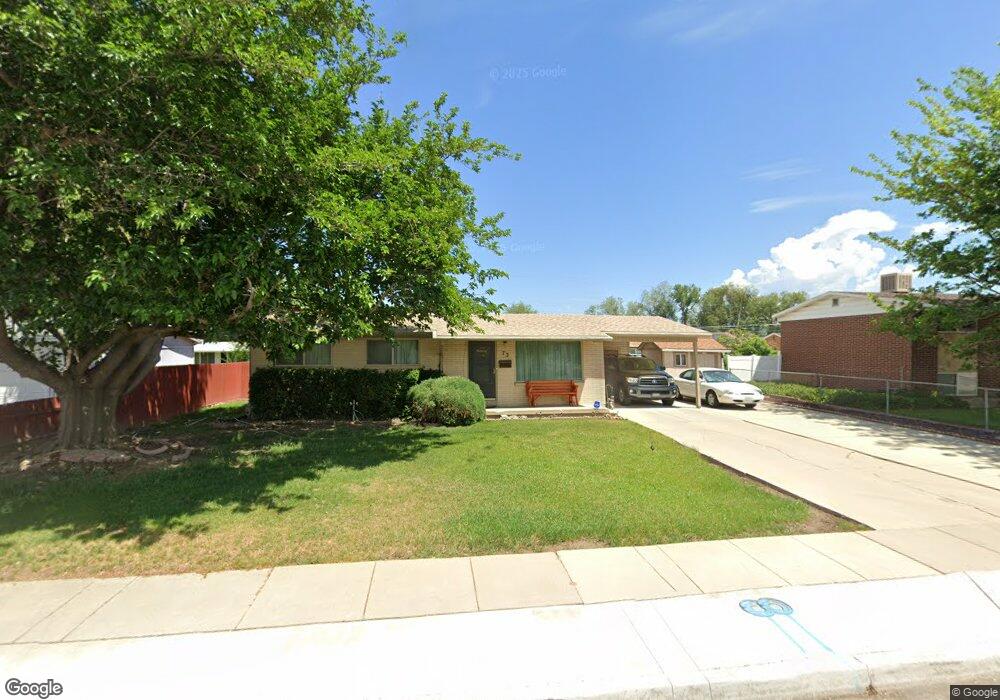
73 Celeste Dr Midvale, UT 84047
Estimated Value: $474,000 - $551,000
4
Beds
2
Baths
975
Sq Ft
$514/Sq Ft
Est. Value
About This Home
This home is located at 73 Celeste Dr, Midvale, UT 84047 and is currently estimated at $501,085, approximately $513 per square foot. 73 Celeste Dr is a home located in Salt Lake County with nearby schools including Midvalley Elementary School, Union Middle School, and Hillcrest High School.
Ownership History
Date
Name
Owned For
Owner Type
Purchase Details
Closed on
Aug 31, 2017
Sold by
Tucker Gail K and Tucker Donald J
Bought by
Tucker Donald J and Tucker Gail K
Current Estimated Value
Home Financials for this Owner
Home Financials are based on the most recent Mortgage that was taken out on this home.
Original Mortgage
$76,000
Outstanding Balance
$63,499
Interest Rate
3.92%
Mortgage Type
New Conventional
Estimated Equity
$437,586
Purchase Details
Closed on
Sep 23, 2016
Sold by
Tucker Gail K and Tucker Donald
Bought by
Tucker Donald J and Tucker Gail K
Home Financials for this Owner
Home Financials are based on the most recent Mortgage that was taken out on this home.
Original Mortgage
$80,000
Interest Rate
3.43%
Mortgage Type
Future Advance Clause Open End Mortgage
Purchase Details
Closed on
Jan 17, 1994
Sold by
Tucker Donald J and Tucker Gail K
Bought by
Tucker Donald J and Tucker Gail K
Create a Home Valuation Report for This Property
The Home Valuation Report is an in-depth analysis detailing your home's value as well as a comparison with similar homes in the area
Home Values in the Area
Average Home Value in this Area
Purchase History
| Date | Buyer | Sale Price | Title Company |
|---|---|---|---|
| Tucker Donald J | -- | Novation Title Ins Agcy | |
| Tucker Gail K | -- | Novation Title Ins Agcy | |
| Tucker Donald J | -- | Novation Title Ins Agcy | |
| Tucker Gail K | -- | Novation Title Ins Agcy | |
| Tucker Donald J | -- | -- |
Source: Public Records
Mortgage History
| Date | Status | Borrower | Loan Amount |
|---|---|---|---|
| Open | Tucker Gail K | $76,000 | |
| Closed | Tucker Gail K | $80,000 |
Source: Public Records
Tax History
| Year | Tax Paid | Tax Assessment Tax Assessment Total Assessment is a certain percentage of the fair market value that is determined by local assessors to be the total taxable value of land and additions on the property. | Land | Improvement |
|---|---|---|---|---|
| 2025 | $2,724 | $469,600 | $156,600 | $313,000 |
| 2024 | $2,724 | $447,300 | $147,000 | $300,300 |
| 2023 | $2,373 | $386,000 | $139,800 | $246,200 |
| 2022 | $2,477 | $393,600 | $137,100 | $256,500 |
| 2021 | $2,213 | $300,700 | $137,100 | $163,600 |
| 2020 | $2,107 | $270,900 | $91,500 | $179,400 |
| 2019 | $2,046 | $256,300 | $86,300 | $170,000 |
| 2016 | $1,720 | $203,100 | $86,300 | $116,800 |
Source: Public Records
Map
Nearby Homes
- 7359 S Dewmar Ct W Unit 32
- 489 E 7800 S Unit 2
- 7363 S Dewmar Ct W Unit 33
- 7342 S Seven Tree Ln W Unit 77
- 7329 S Seven Tree Ln W Unit 85
- 7371 S Dewmar Ct W Unit 35
- 7327 S Seven Tree Ln W Unit 86
- 7337 S Seven Tree Ln W Unit 82
- 7343 S Seven Tree Ln Unit 79
- 7355 S Dewmar Ct W Unit 31
- 110 Greenwood Ave
- 108 W Ryker Ln Unit 16
- 190 E White Spruce Cove Unit 805
- 7824 S 280 E
- 220 E Greenwood Ave
- 135 E Station St
- 30 W 7500 S Unit 18
- 7571 S Blisswood Dr #20 Dr Unit 20
- 330 E 7635 S Unit 344
- 7613 S 300 E
Your Personal Tour Guide
Ask me questions while you tour the home.