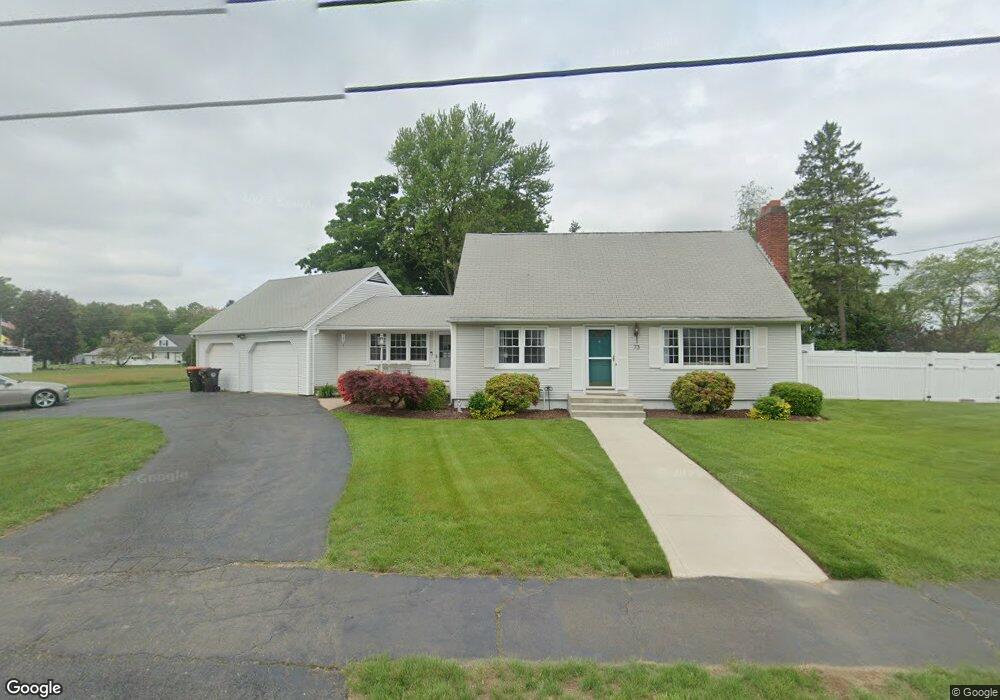
73 Cherry St Feeding Hills, MA 01030
Estimated Value: $409,383 - $552,000
3
Beds
2
Baths
1,799
Sq Ft
$252/Sq Ft
Est. Value
About This Home
This home is located at 73 Cherry St, Feeding Hills, MA 01030 and is currently estimated at $452,596, approximately $251 per square foot. 73 Cherry St is a home located in Hampden County with nearby schools including Agawam Junior High School, Agawam High School, and St Thomas The Apostle School.
Ownership History
Date
Name
Owned For
Owner Type
Purchase Details
Closed on
Sep 27, 2004
Sold by
Porter Frances C and Porter John G
Bought by
Grindle Diane M and Grindle James A
Current Estimated Value
Home Financials for this Owner
Home Financials are based on the most recent Mortgage that was taken out on this home.
Original Mortgage
$185,000
Outstanding Balance
$92,357
Interest Rate
5.89%
Mortgage Type
Purchase Money Mortgage
Estimated Equity
$360,239
Create a Home Valuation Report for This Property
The Home Valuation Report is an in-depth analysis detailing your home's value as well as a comparison with similar homes in the area
Home Values in the Area
Average Home Value in this Area
Purchase History
| Date | Buyer | Sale Price | Title Company |
|---|---|---|---|
| Grindle Diane M | $275,000 | -- |
Source: Public Records
Mortgage History
| Date | Status | Borrower | Loan Amount |
|---|---|---|---|
| Open | Grindle Diane M | $185,000 |
Source: Public Records
Tax History
| Year | Tax Paid | Tax Assessment Tax Assessment Total Assessment is a certain percentage of the fair market value that is determined by local assessors to be the total taxable value of land and additions on the property. | Land | Improvement |
|---|---|---|---|---|
| 2025 | $5,172 | $353,300 | $113,100 | $240,200 |
| 2024 | $4,992 | $343,300 | $113,100 | $230,200 |
| 2023 | $5,168 | $327,500 | $107,400 | $220,100 |
| 2022 | $4,930 | $306,000 | $107,400 | $198,600 |
| 2021 | $4,751 | $280,000 | $92,700 | $187,300 |
| 2020 | $4,573 | $271,700 | $91,100 | $180,600 |
| 2019 | $4,436 | $266,400 | $89,100 | $177,300 |
| 2018 | $4,214 | $253,700 | $89,100 | $164,600 |
| 2017 | $3,993 | $244,800 | $89,100 | $155,700 |
| 2016 | $3,861 | $238,600 | $89,100 | $149,500 |
| 2015 | $3,666 | $232,900 | $89,100 | $143,800 |
Source: Public Records
Map
Nearby Homes
- lot A North St
- 40 Nolan Ln
- 29 Lincoln St
- 157 Cambridge St
- 712 Cooper St
- 44 Depalma St
- 25 Damato Way
- 88 Country Rd
- 0 Harvard Ave Unit 73471441
- 36-38 Orlando St
- 190 Mill St
- 999 N Street Extension
- 354 Rowley St
- 43 Houston Rd
- 73 Silver Lake Dr
- 144 Almon Ave
- 30 S Westfield St
- 554-556 Franklin Street Extension
- 304-306 Cooper St
- 42 Anthony St
Your Personal Tour Guide
Ask me questions while you tour the home.