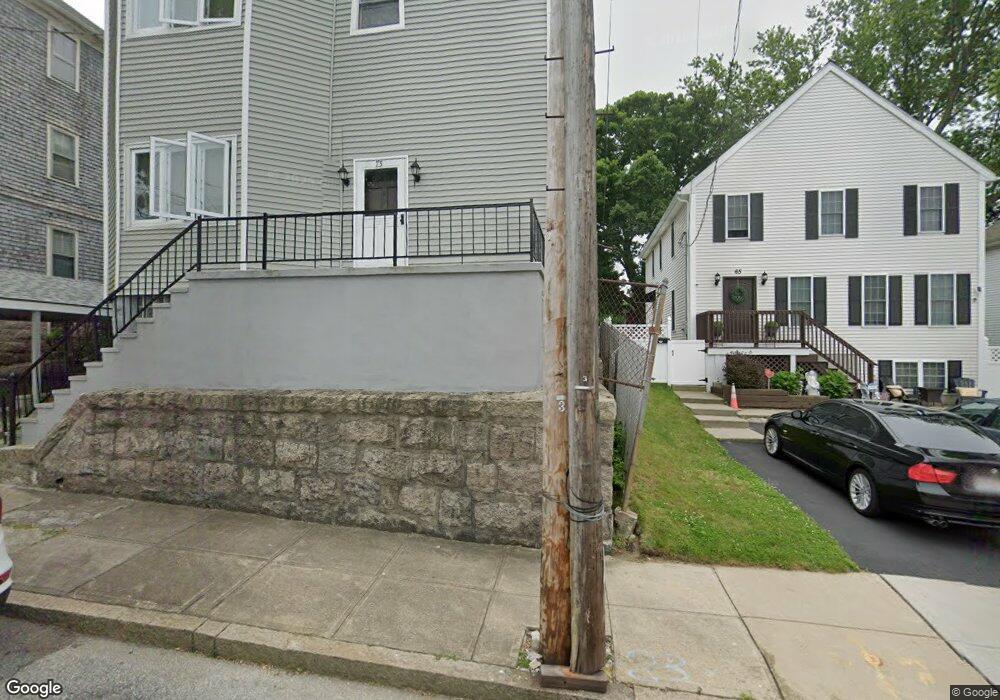
73 Chesworth St Fall River, MA 02723
Flint NeighborhoodEstimated Value: $405,000 - $668,000
9
Beds
3
Baths
3,687
Sq Ft
$142/Sq Ft
Est. Value
About This Home
This home is located at 73 Chesworth St, Fall River, MA 02723 and is currently estimated at $525,094, approximately $142 per square foot. 73 Chesworth St is a home located in Bristol County with nearby schools including Mary Fonseca Elementary School, Talbot Innovation School, and B M C Durfee High School.
Ownership History
Date
Name
Owned For
Owner Type
Purchase Details
Closed on
Dec 23, 2016
Sold by
Bettencourt Thomas R and Bettencourt Donna M
Bought by
Bettenourt Ft
Current Estimated Value
Purchase Details
Closed on
Mar 19, 2001
Sold by
Bettencourt John T
Bought by
Bettencourt Thomas R and Bettencourt Donna M
Home Financials for this Owner
Home Financials are based on the most recent Mortgage that was taken out on this home.
Original Mortgage
$93,800
Interest Rate
7.01%
Mortgage Type
Purchase Money Mortgage
Purchase Details
Closed on
Dec 26, 1997
Sold by
Bettencourt Thomas J and Bettencourt Patricia
Bought by
Bettencourt John T
Home Financials for this Owner
Home Financials are based on the most recent Mortgage that was taken out on this home.
Original Mortgage
$116,000
Interest Rate
6.95%
Create a Home Valuation Report for This Property
The Home Valuation Report is an in-depth analysis detailing your home's value as well as a comparison with similar homes in the area
Home Values in the Area
Average Home Value in this Area
Purchase History
| Date | Buyer | Sale Price | Title Company |
|---|---|---|---|
| Bettenourt Ft | -- | -- | |
| Bettencourt Thomas R | $134,000 | -- | |
| Bettencourt John T | $145,000 | -- |
Source: Public Records
Mortgage History
| Date | Status | Borrower | Loan Amount |
|---|---|---|---|
| Previous Owner | Bettencourt John T | $118,000 | |
| Previous Owner | Bettencourt John T | $93,800 | |
| Previous Owner | Bettencourt John T | $116,000 |
Source: Public Records
Tax History
| Year | Tax Paid | Tax Assessment Tax Assessment Total Assessment is a certain percentage of the fair market value that is determined by local assessors to be the total taxable value of land and additions on the property. | Land | Improvement |
|---|---|---|---|---|
| 2025 | $5,501 | $480,400 | $107,400 | $373,000 |
| 2024 | $5,258 | $457,600 | $103,400 | $354,200 |
| 2023 | $4,655 | $379,400 | $85,400 | $294,000 |
| 2022 | $4,137 | $327,800 | $81,400 | $246,400 |
| 2021 | $3,918 | $283,300 | $77,400 | $205,900 |
| 2020 | $3,524 | $243,900 | $76,300 | $167,600 |
| 2019 | $3,011 | $206,500 | $73,500 | $133,000 |
| 2018 | $2,925 | $200,100 | $79,600 | $120,500 |
| 2017 | $2,748 | $196,300 | $75,800 | $120,500 |
| 2016 | $2,700 | $198,100 | $80,700 | $117,400 |
| 2015 | $2,591 | $198,100 | $80,700 | $117,400 |
| 2014 | $2,605 | $207,100 | $78,300 | $128,800 |
Source: Public Records
Map
Nearby Homes
- 150 Downing St
- 165 Eastern Ave
- 580 County St
- 10 Carlisa Dr
- 70 Jencks St
- 88 Harrison St Unit 5
- 243 Oak Grove Ave
- 129 County St
- 84 Healy St
- 178 Thomas St
- 1244 Pleasant St
- 1155-1157 Pleasant St
- 869 Bedford St
- 756 County St
- 139 Quarry St
- 529 Eastern Ave
- 847 Pleasant St
- 152 Alden St
- 31 Choate St
- 25 Lebanon St Unit D
- 65 Chesworth St
- 79 Chesworth St
- 57 Eastern Ave
- 55 Eastern Ave
- 57 Chesworth St
- 72 Talbot St
- 65 Eastern Ave
- 53 Eastern Ave
- 62 Talbot St
- 70 Talbot St
- 55 U S 6
- 77 Eastern Ave
- 60 Chesworth St
- 60 Chesworth St Unit 1
- 46 Talbot St
- 39 Chesworth St Unit 3
- 39 Chesworth St
- 12 Talbot St
- 83 Talbot St
- 1315 Bedford St
Your Personal Tour Guide
Ask me questions while you tour the home.