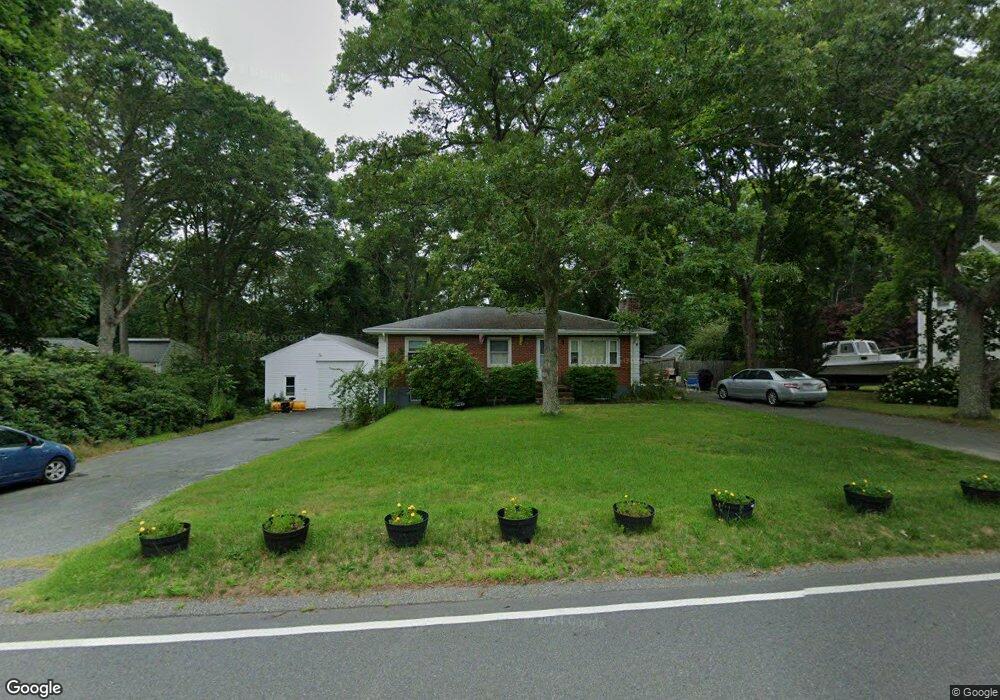
73 Clay Pond Rd Bourne, MA 02532
Monument Beach NeighborhoodEstimated Value: $494,016 - $518,000
3
Beds
2
Baths
960
Sq Ft
$532/Sq Ft
Est. Value
About This Home
This home is located at 73 Clay Pond Rd, Bourne, MA 02532 and is currently estimated at $510,504, approximately $531 per square foot. 73 Clay Pond Rd is a home located in Barnstable County with nearby schools including Bourne High School, Cadence Academy Preschool - Bourne, and St Margaret Regional School.
Ownership History
Date
Name
Owned For
Owner Type
Purchase Details
Closed on
Dec 9, 2021
Sold by
Knutila Anita C
Bought by
Fitzmaurice Scott A
Current Estimated Value
Home Financials for this Owner
Home Financials are based on the most recent Mortgage that was taken out on this home.
Original Mortgage
$382,936
Outstanding Balance
$350,897
Interest Rate
3.14%
Mortgage Type
FHA
Estimated Equity
$159,607
Create a Home Valuation Report for This Property
The Home Valuation Report is an in-depth analysis detailing your home's value as well as a comparison with similar homes in the area
Home Values in the Area
Average Home Value in this Area
Purchase History
| Date | Buyer | Sale Price | Title Company |
|---|---|---|---|
| Fitzmaurice Scott A | $390,000 | None Available | |
| Fitzmaurice Scott A | $390,000 | None Available |
Source: Public Records
Mortgage History
| Date | Status | Borrower | Loan Amount |
|---|---|---|---|
| Open | Fitzmaurice Scott A | $382,936 | |
| Closed | Fitzmaurice Scott A | $382,936 |
Source: Public Records
Tax History
| Year | Tax Paid | Tax Assessment Tax Assessment Total Assessment is a certain percentage of the fair market value that is determined by local assessors to be the total taxable value of land and additions on the property. | Land | Improvement |
|---|---|---|---|---|
| 2025 | $3,141 | $402,200 | $178,600 | $223,600 |
| 2024 | $3,072 | $383,000 | $170,100 | $212,900 |
| 2023 | $2,996 | $340,100 | $150,600 | $189,500 |
| 2022 | $2,880 | $285,400 | $133,200 | $152,200 |
| 2021 | $2,811 | $261,000 | $121,200 | $139,800 |
| 2020 | $2,717 | $253,000 | $120,100 | $132,900 |
| 2019 | $2,589 | $246,300 | $120,100 | $126,200 |
| 2018 | $2,535 | $240,500 | $114,400 | $126,100 |
| 2017 | $2,395 | $232,500 | $107,600 | $124,900 |
| 2016 | $2,308 | $227,200 | $107,600 | $119,600 |
| 2015 | $2,174 | $215,900 | $96,300 | $119,600 |
Source: Public Records
Map
Nearby Homes
- 61 Thom Ave
- 93 Valley Bars Rd
- 18 Douglas Ave
- 566 Shore Rd
- 16 Amberwood Ct
- 203 County Rd
- 12 Turnberry Rd Unit 12
- 39 Bennets Neck Dr
- 26 Carnoustie Rd
- 13 Laurel Hill Ct
- 4 Hollyhock Knoll Ct Unit 4
- 4 Hollyhock Knoll Ct Unit 4
- 1 Hollyhock Knoll Ct Unit 1
- 5 Sea Knoll Ct
- 709 County Rd
- 3 1st St
- 14 Navajo Rd
- 3 4th Ave
- 254 Barlows Landing Rd
- 7 4th Ave
- 77 Clay Pond Rd
- 69 Clay Pond Rd
- 79 Clay Pond Rd
- 76 Clay Pond Rd
- 57 Clay Pond Rd
- 76 Clay Pond Rd
- 70 Clay Pond Rd Unit B
- 66 Clay Pond Rd
- 82 Clay Pond Rd
- 57 Clay Pond Rd
- 66 Clay Pond Rd
- 88 Clay Pond Rd
- 87 Clay Pond Rd
- 88 Clay Pond Rd
- 60 Clay Pond Rd
- 45 Thom Ave
- 41 Thom Ave
- 43 Thom Ave
- 55 Clay Pond Rd
- 55 Clay Pond Rd